
Creating My First App
This page will help you get started with Bhuma. You'll be up and running in a jiffy!
Bhuma offers a seamless experience for integrating sophisticated solutions into your workflows. This guide will walk you through building a project management application like the example below. Discover how Bhuma can transform your approach to app building, making it more efficient and user-friendly.
1. Set up the data source
Bhuma can interact with almost any API or database, like SQL, REST, and GraphQL, including multiple integrations for many data sources. After configuring your data source, you can build apps using your data.
This guide uses the REST dummy/fake JSON data as a placeholder for the data source.
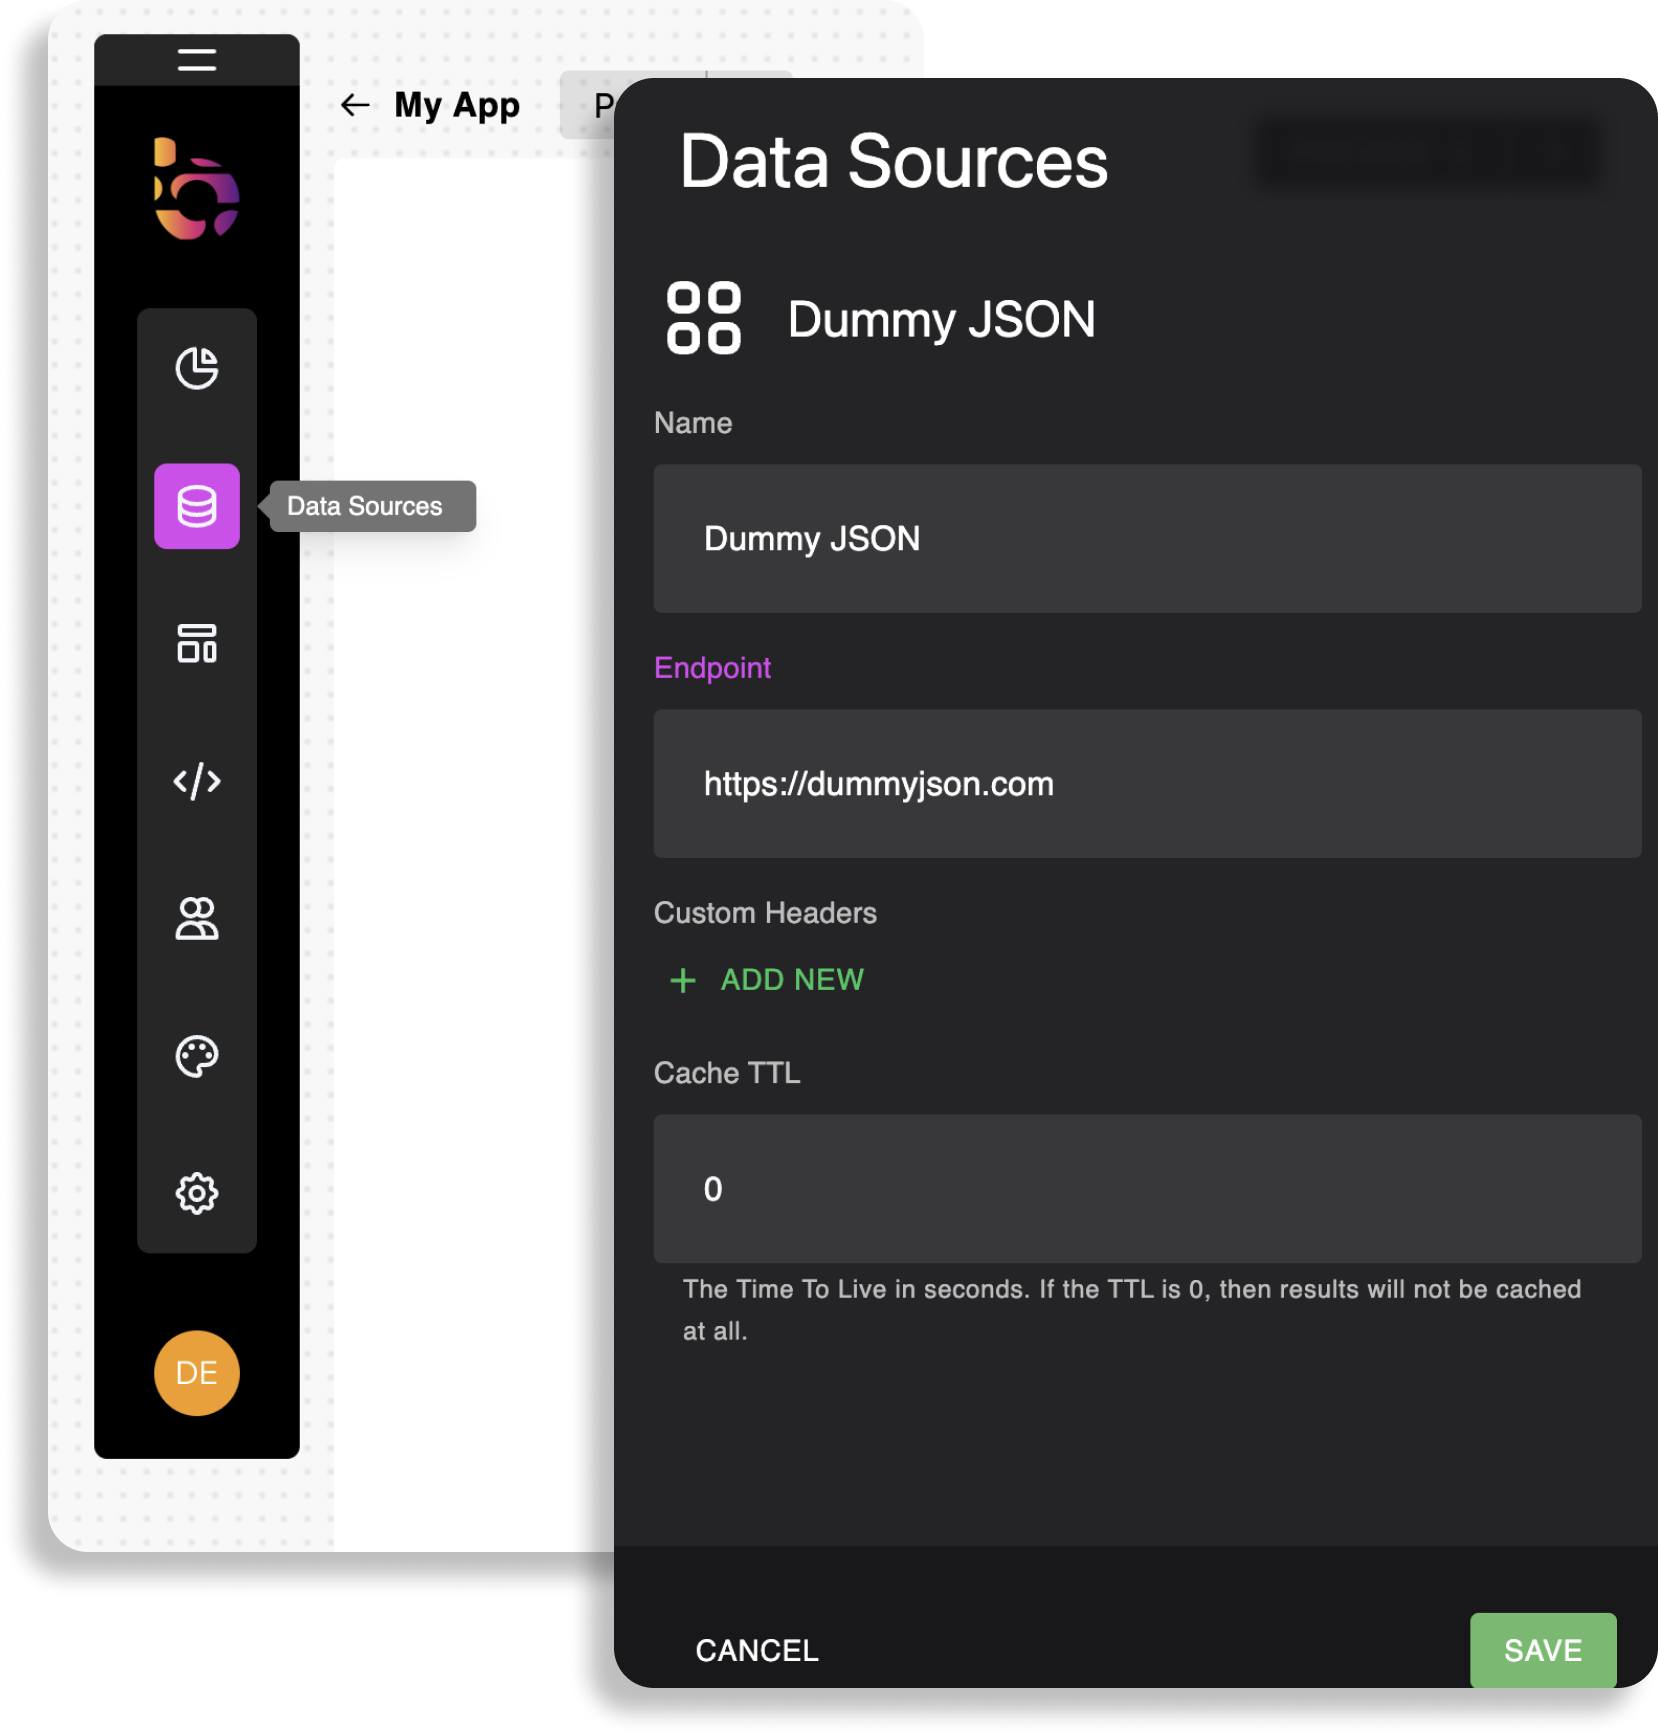
To configure your data source within Bhuma, follow the steps below.
1- Log in to Bhuma. If you don't have an account, sign up for free.
2- Click on Data Sources in the toolbar, then under Others, select REST.
3- Name the data source and add the API URL https://dummyjson.com
4- Click Save.
2. Building your app
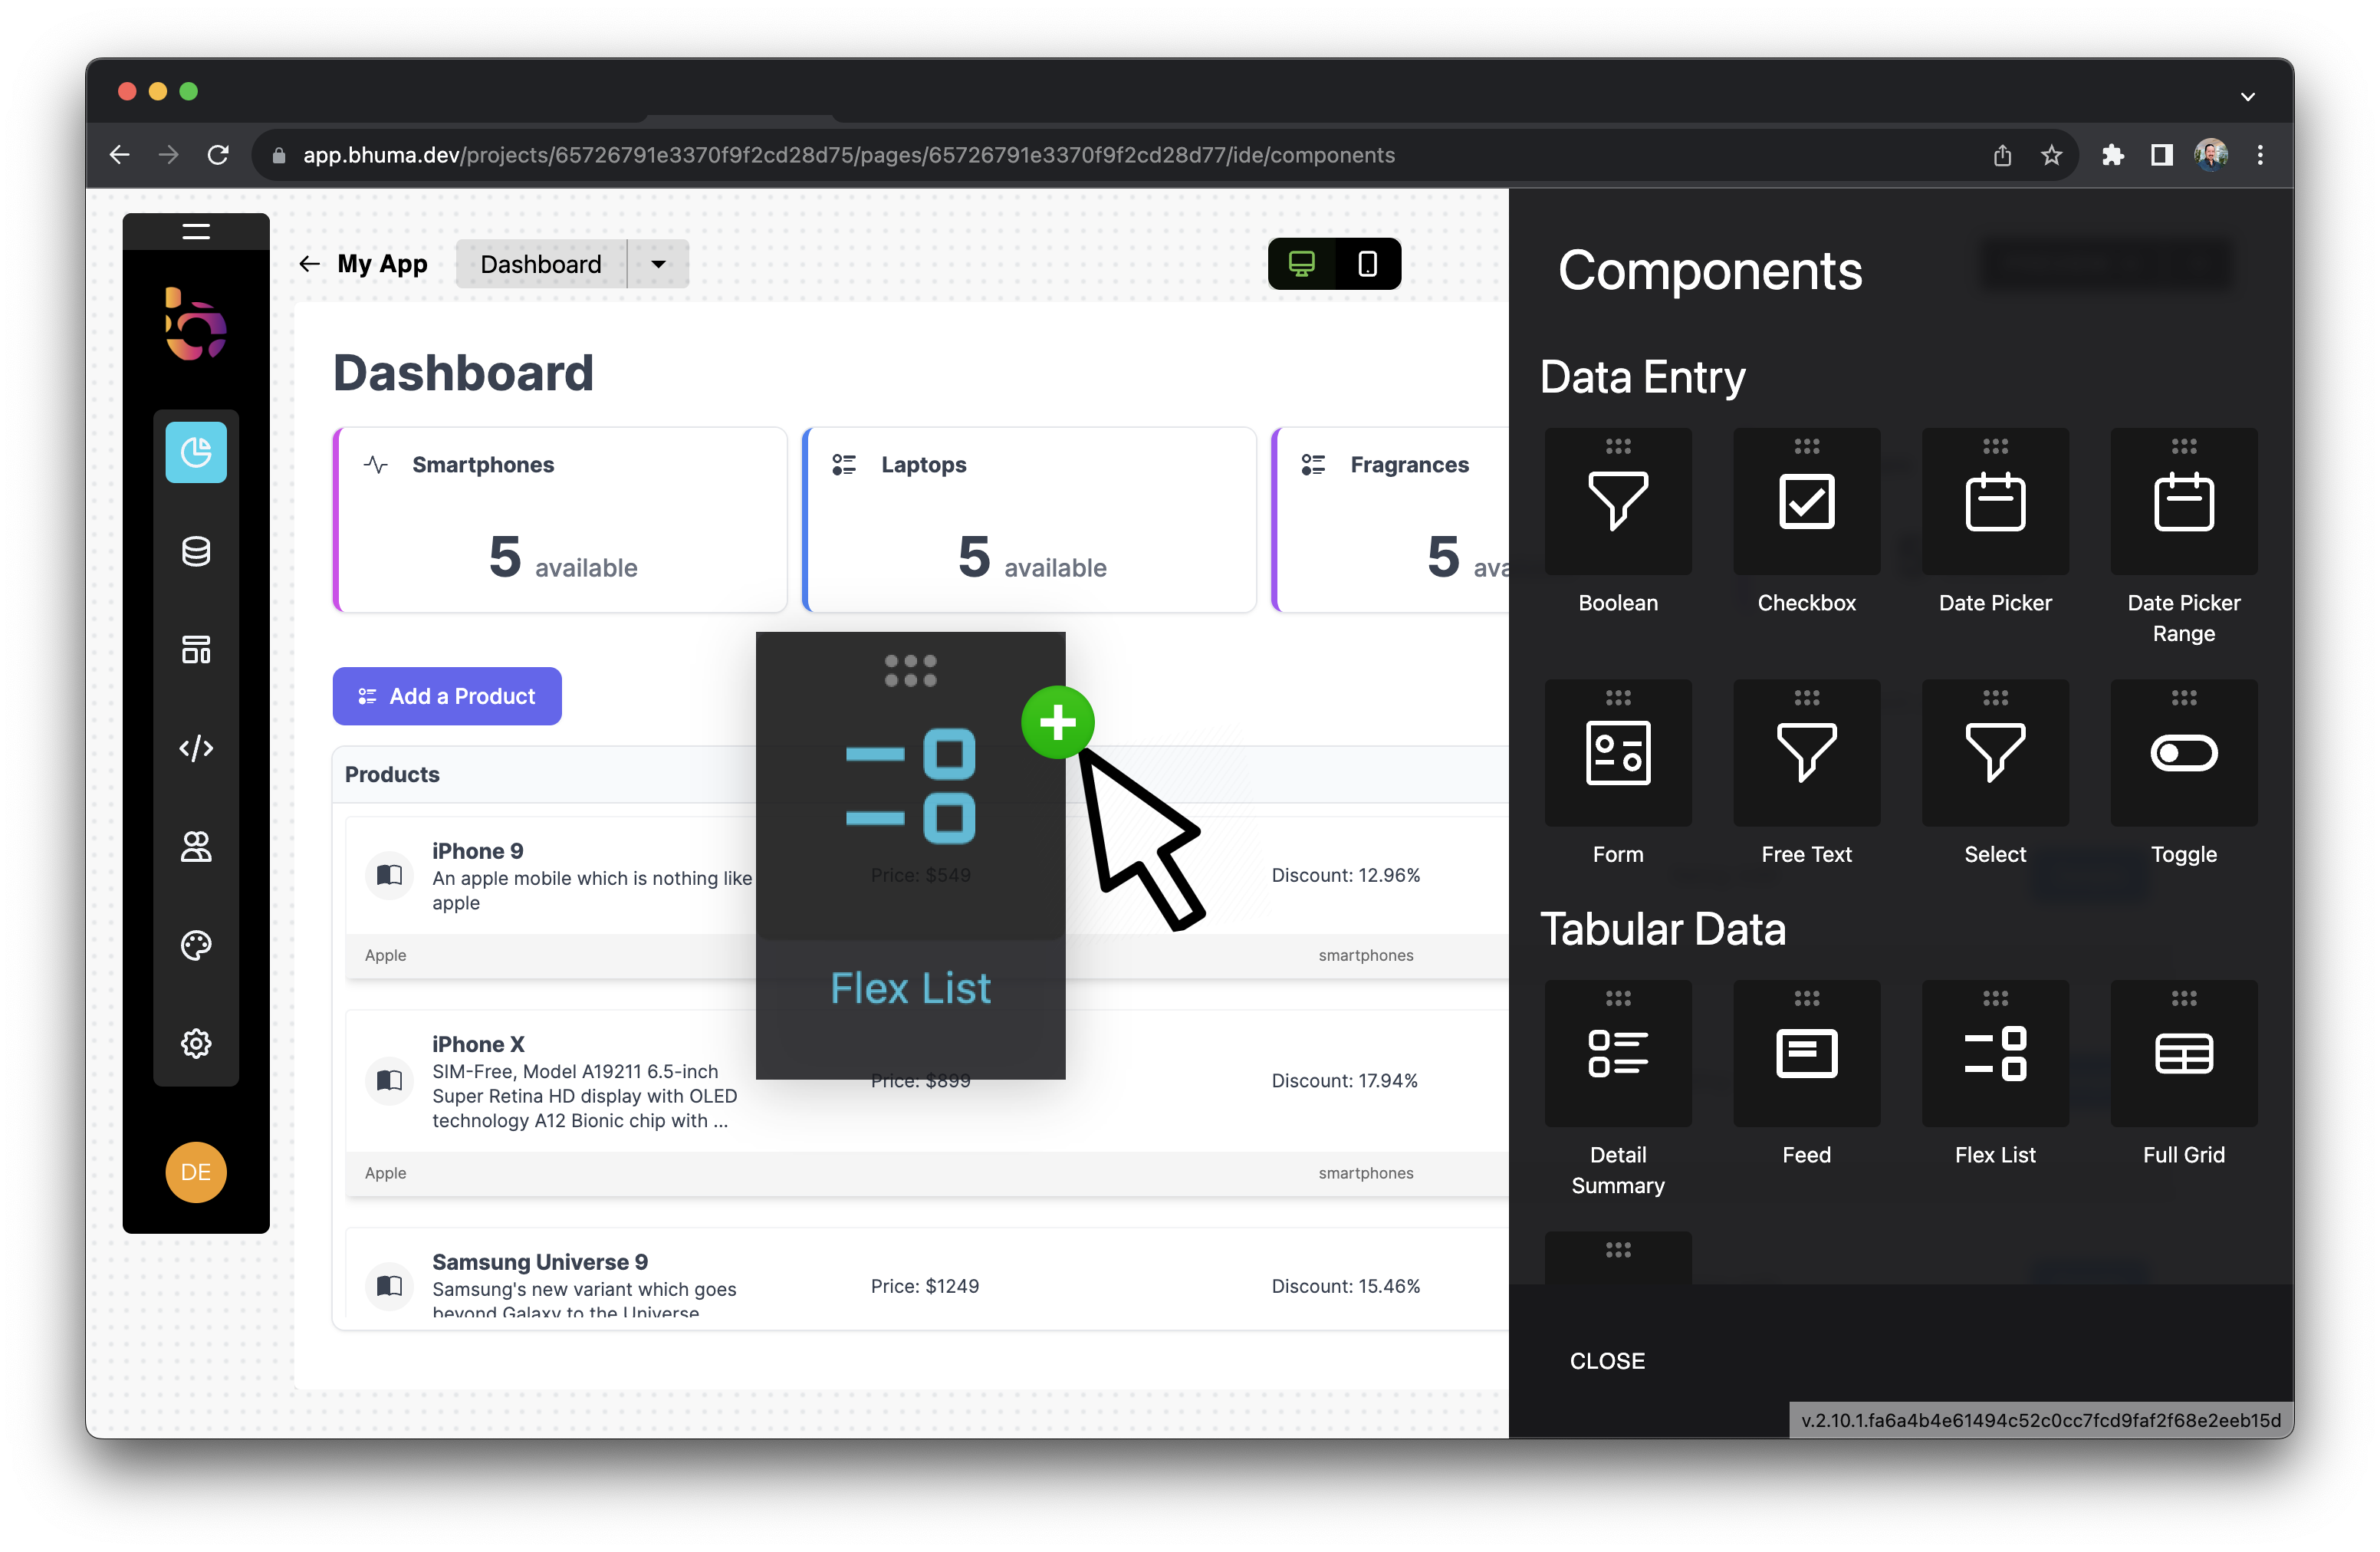
Adding a flex list
Assembling components to your dashboard is very easy; pick the flex list component and drag it into the canvas.
Connecting the component to the data source
Add the data source to the flex list component and configure the API call.
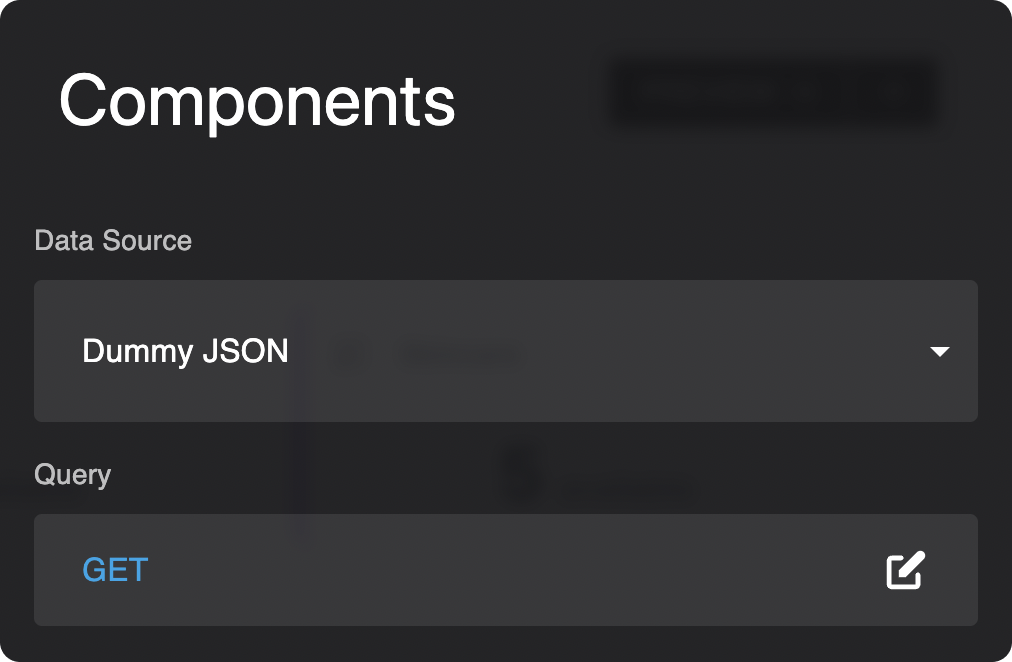
1- Click on the flex list component to access the config panel.
2- Select the data source.
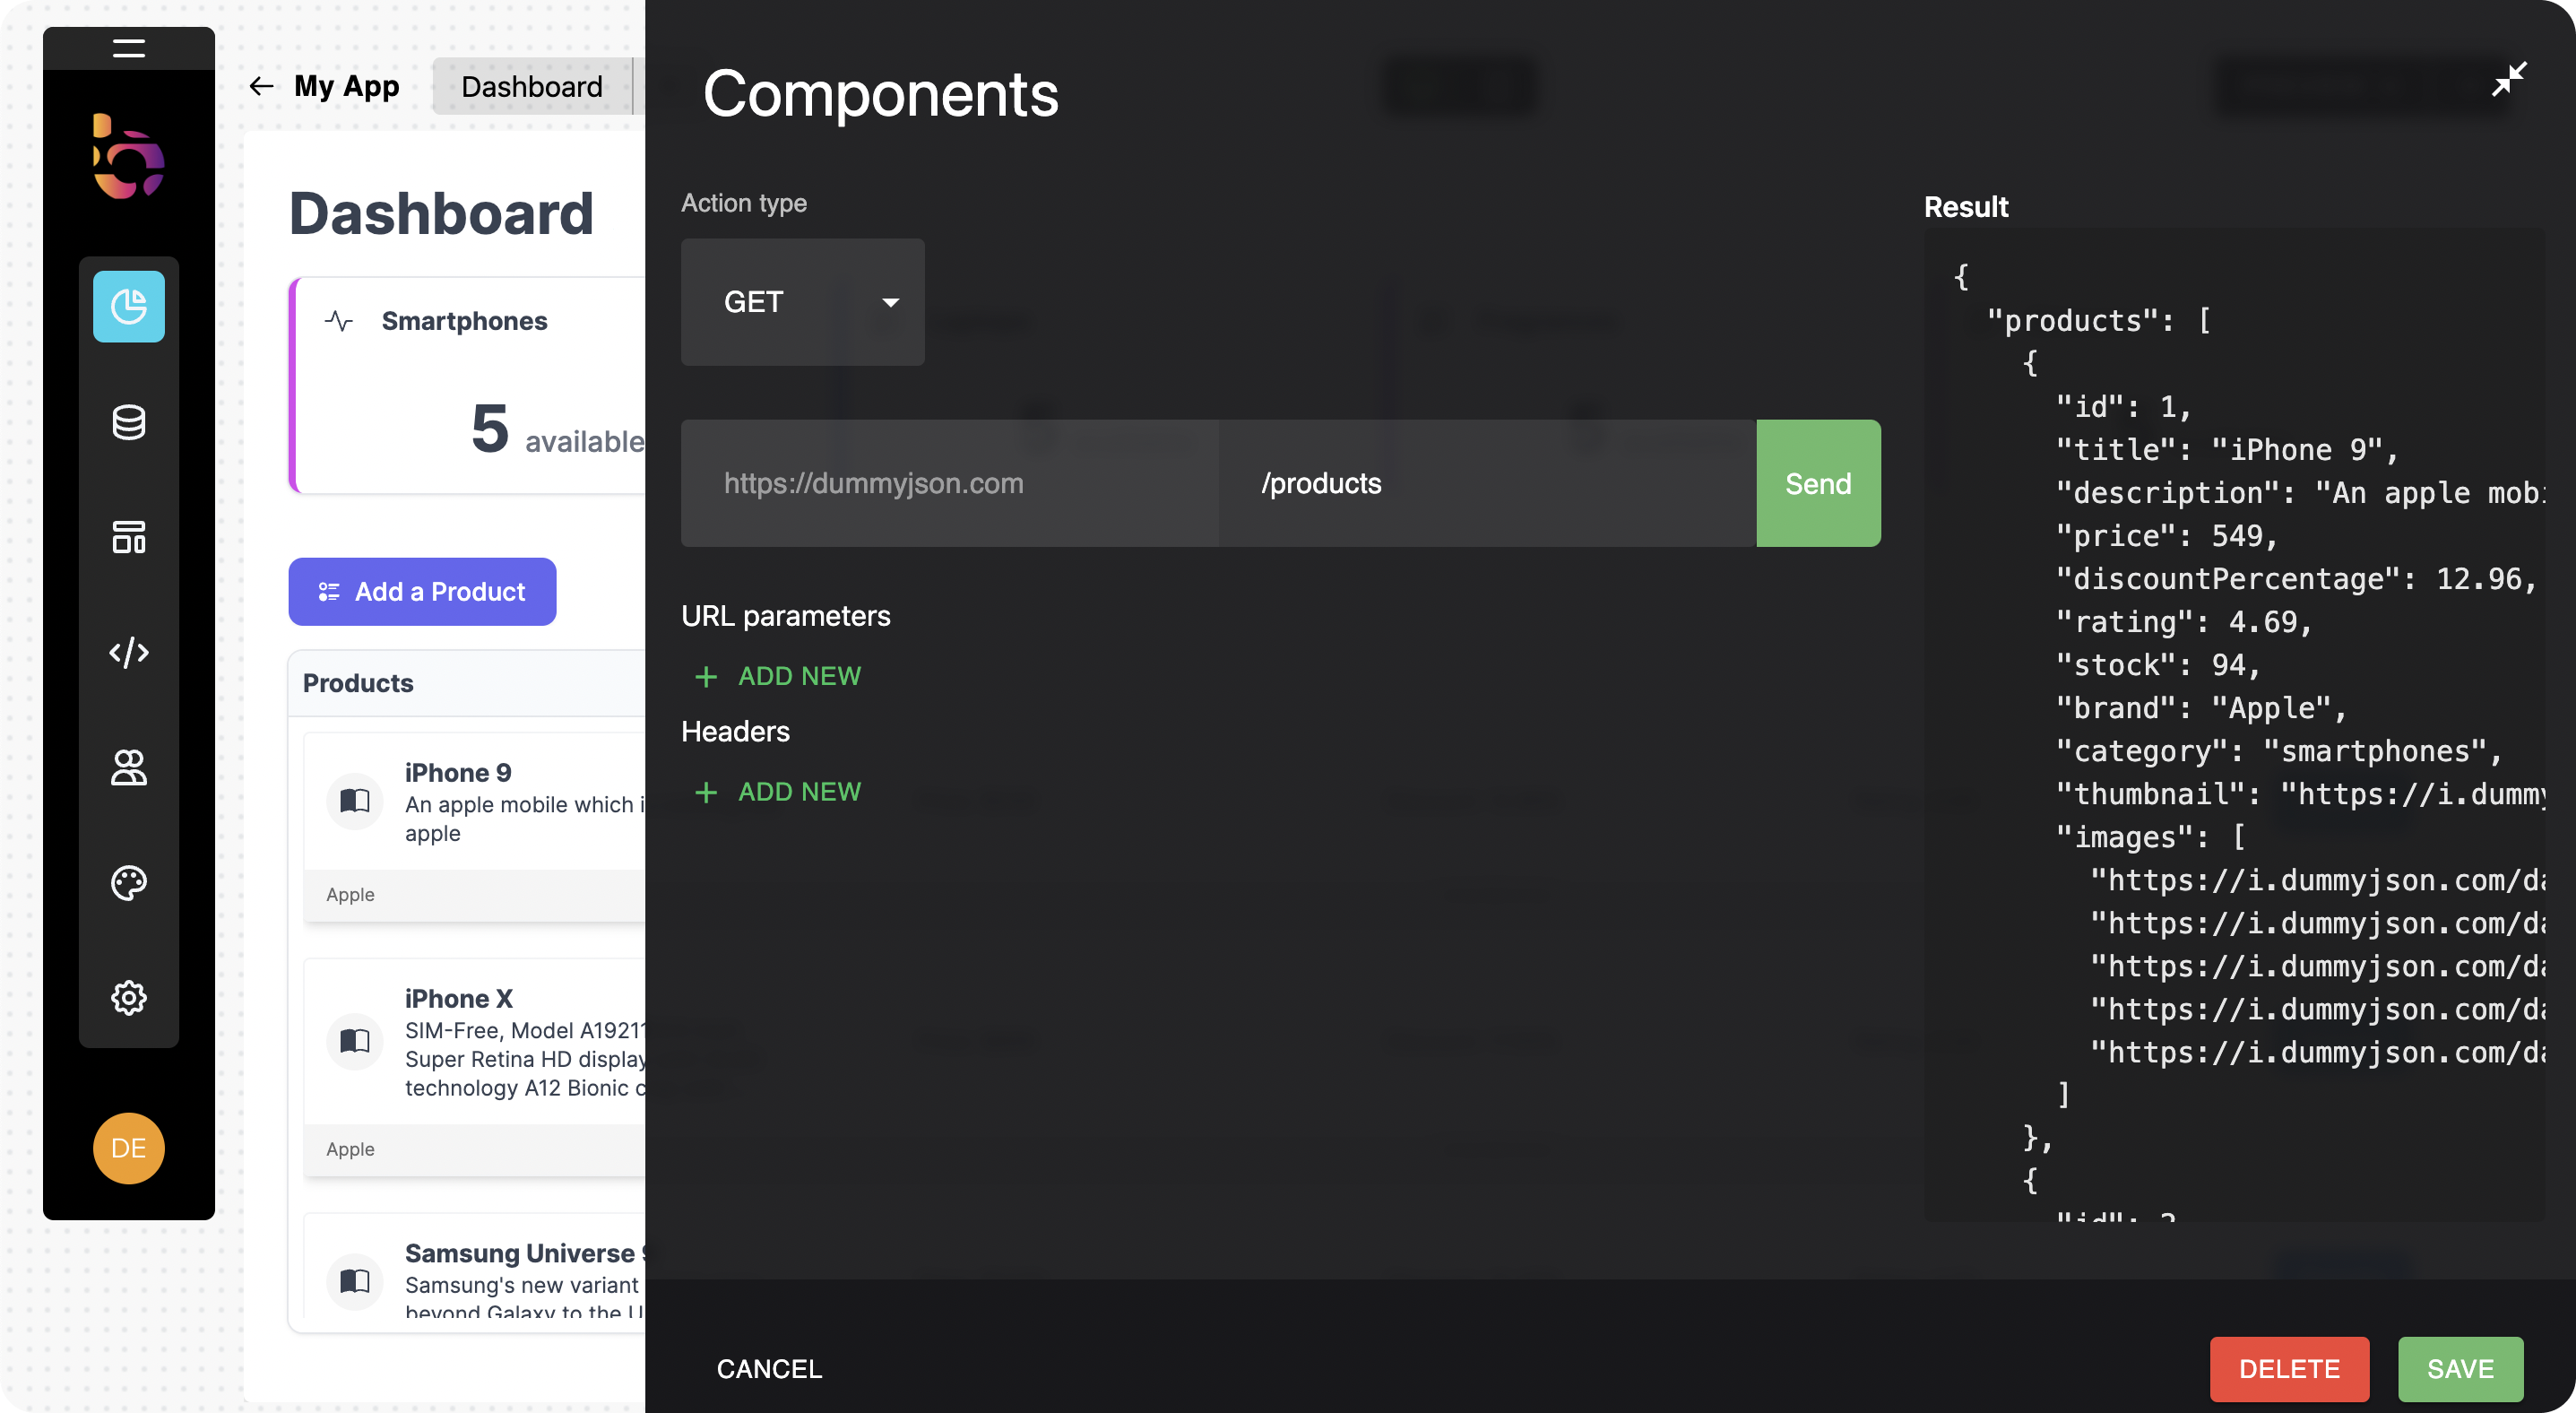
3- Click on the query to configure the GET request.
Once in the query panel, add the URI /productsto feed the component.
Setting up the flex-list component
Once the component is connected to your data source, we need to map the component fields to the data structure as follows:
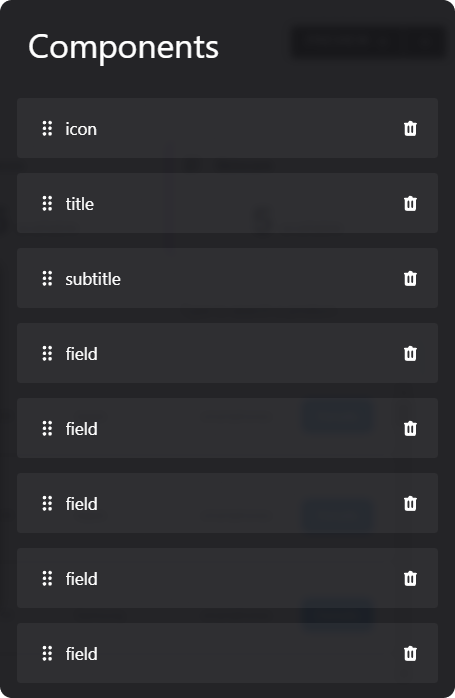
Select the following fields
Icon, and set the valuebook-half.title, set the valuetitleand width 0.subtitle, and choose the valuedescription, and width 40.field, and add valuePrice: ${{ item.price }}and width 20.field, and add valueDiscount: {{ item.discountPercentage }}%and width 20.field, and add valueRating: {{ item.rating }}and width 20.field, and choose the valuebrandand width 20.field, and choose the valuecategoryand width 20.
Adding a KPI to show goals
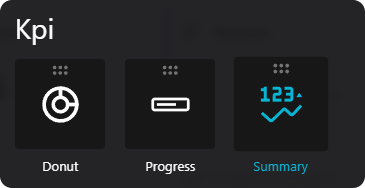
Select the KPI summary component and drag it into the canvas.
Setting up the summary component
- Add a
titleandicon - Choose the
data sourceas Dummy JSON. - Click on the query to configure the GET request as
/products/category/smartphones
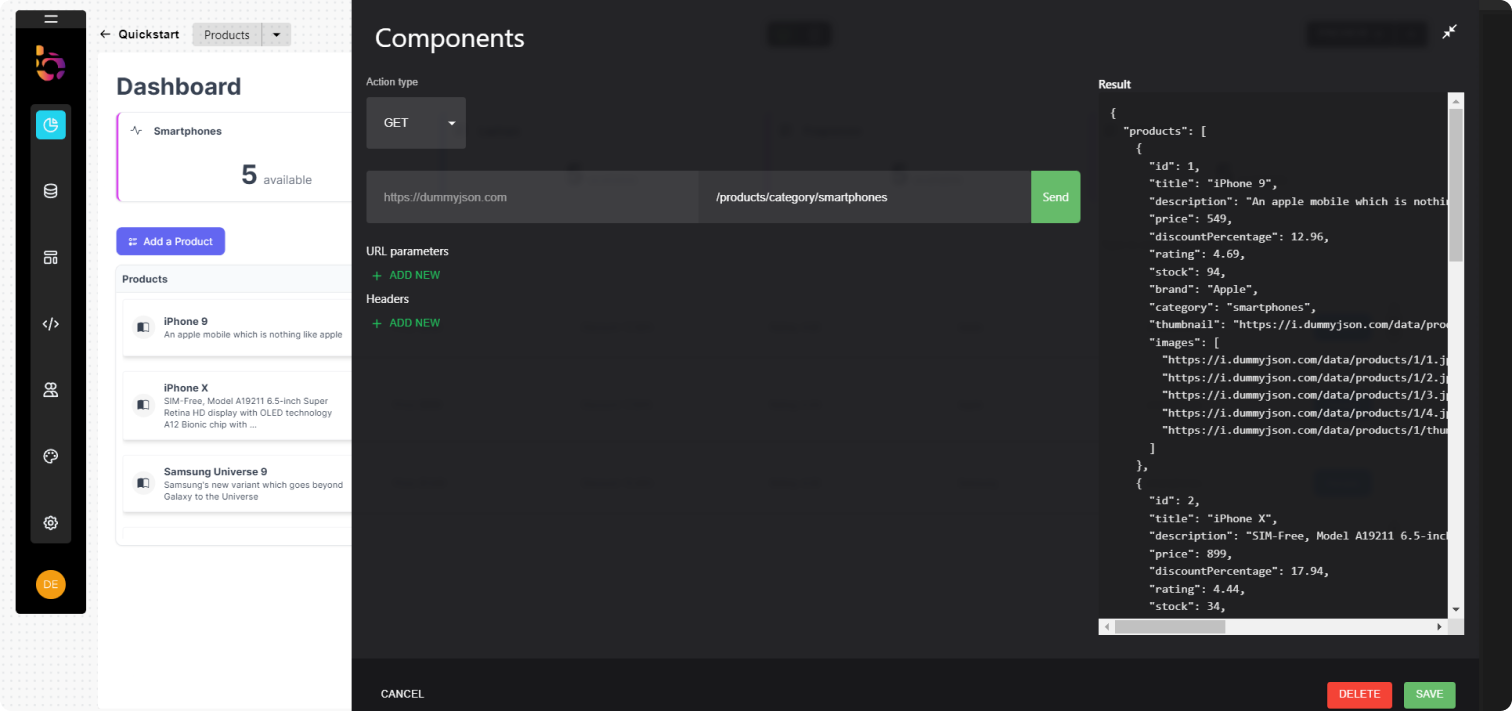
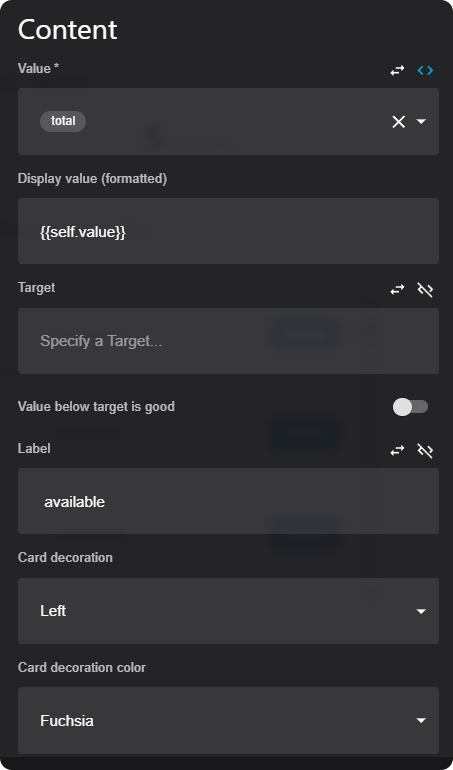
- Select the
valueastotal - On
display valueadd{{self.value}} - Finish style config.
Creating a side panel
Now, we will add a side panel with a form allowing us to access and modify the product details.
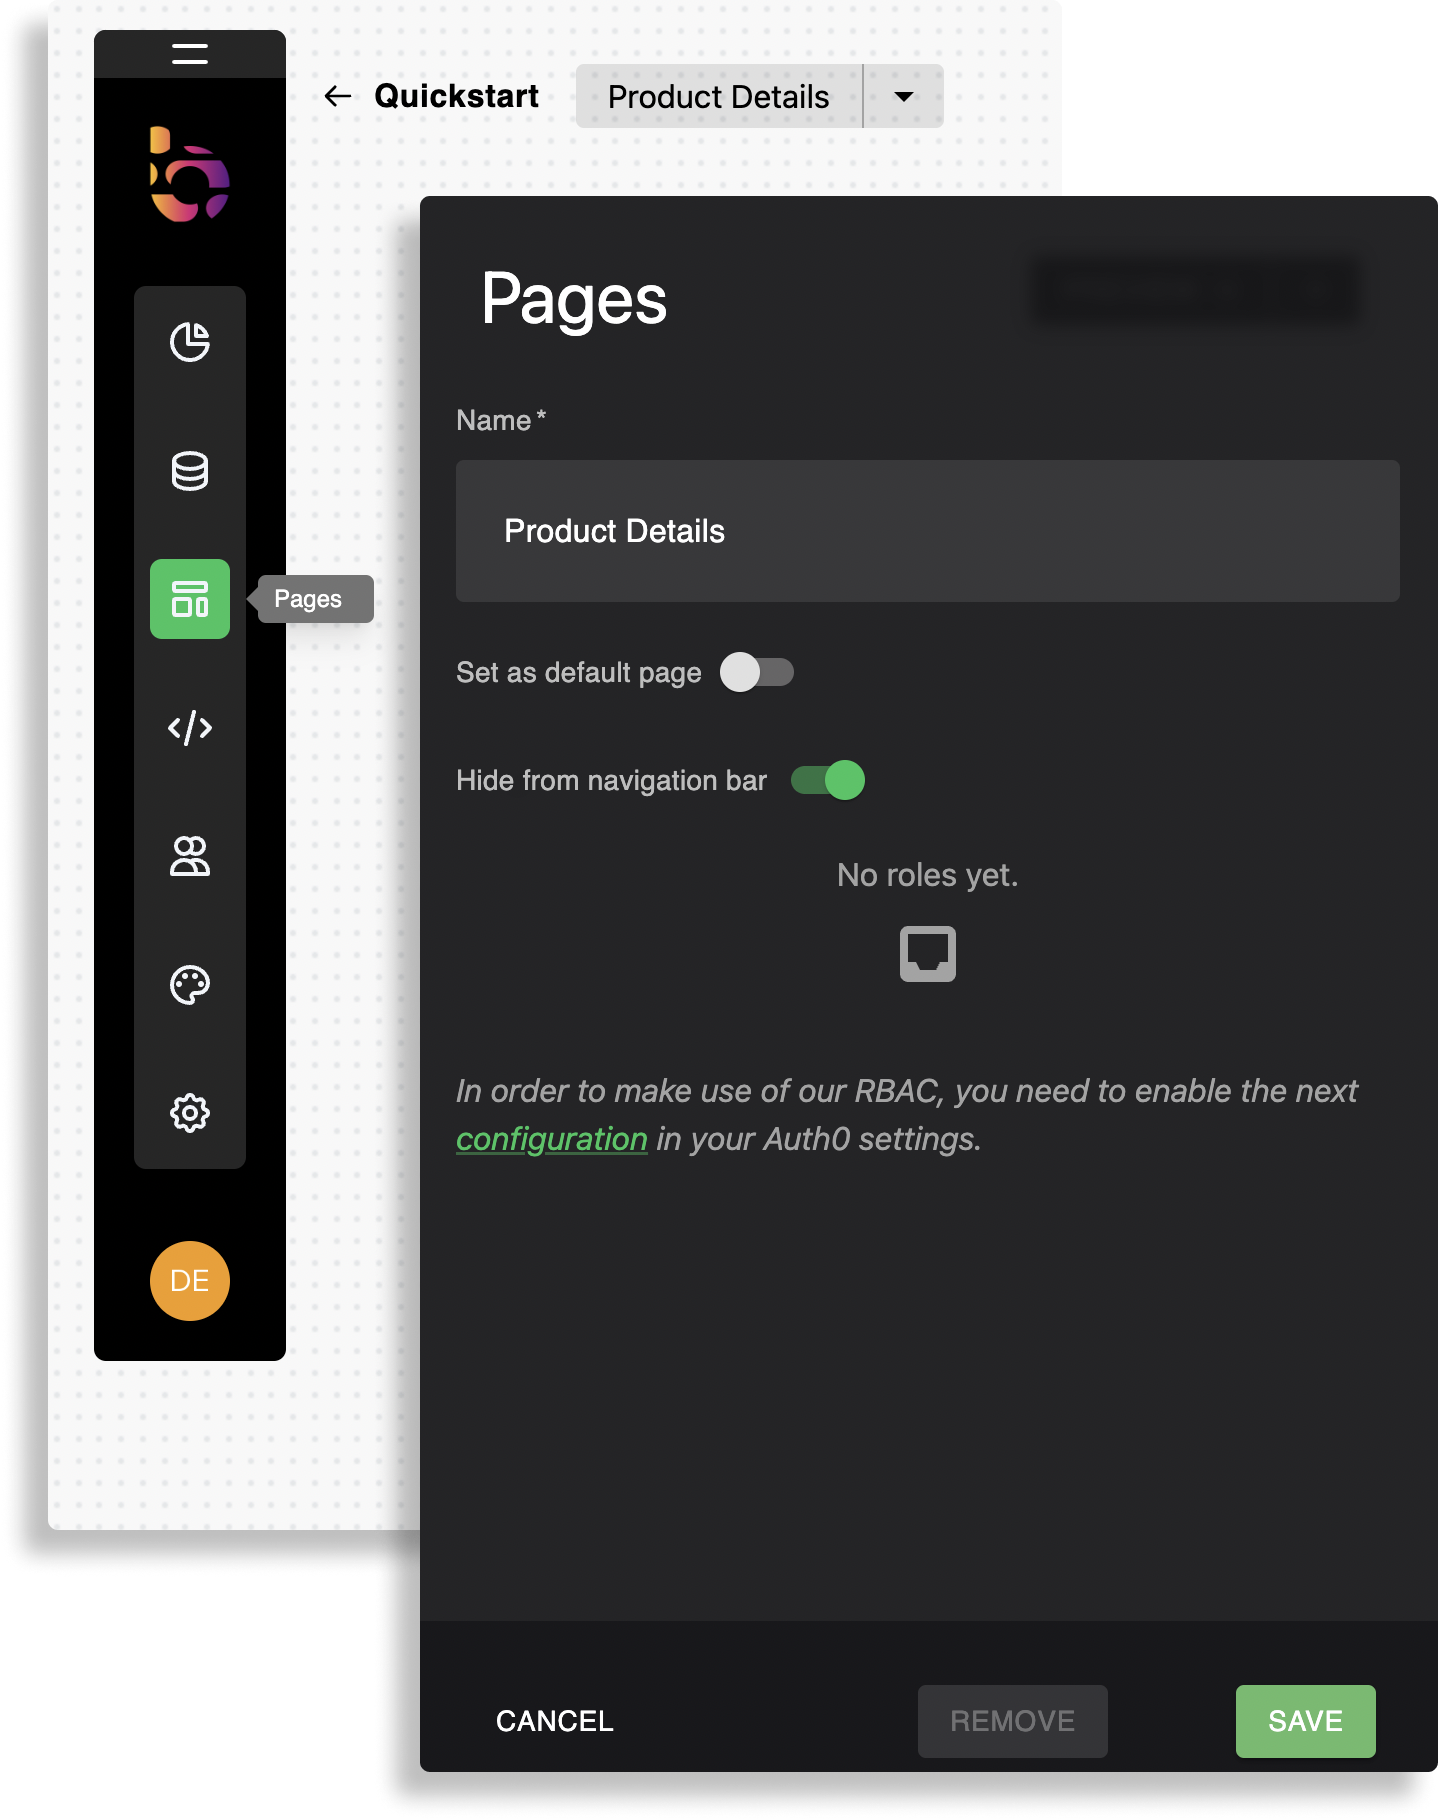
Add a new page
1- Click the plus icon to add a new page for our side panel.
2- Click on hide from navigation since this is a side panel view only.
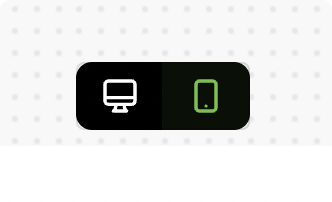
Switch to side panel view
While designing your app, you can switch between layouts. The side panel view can also used to improve a mobile layout.
Adding forms
Let's add a form for product details
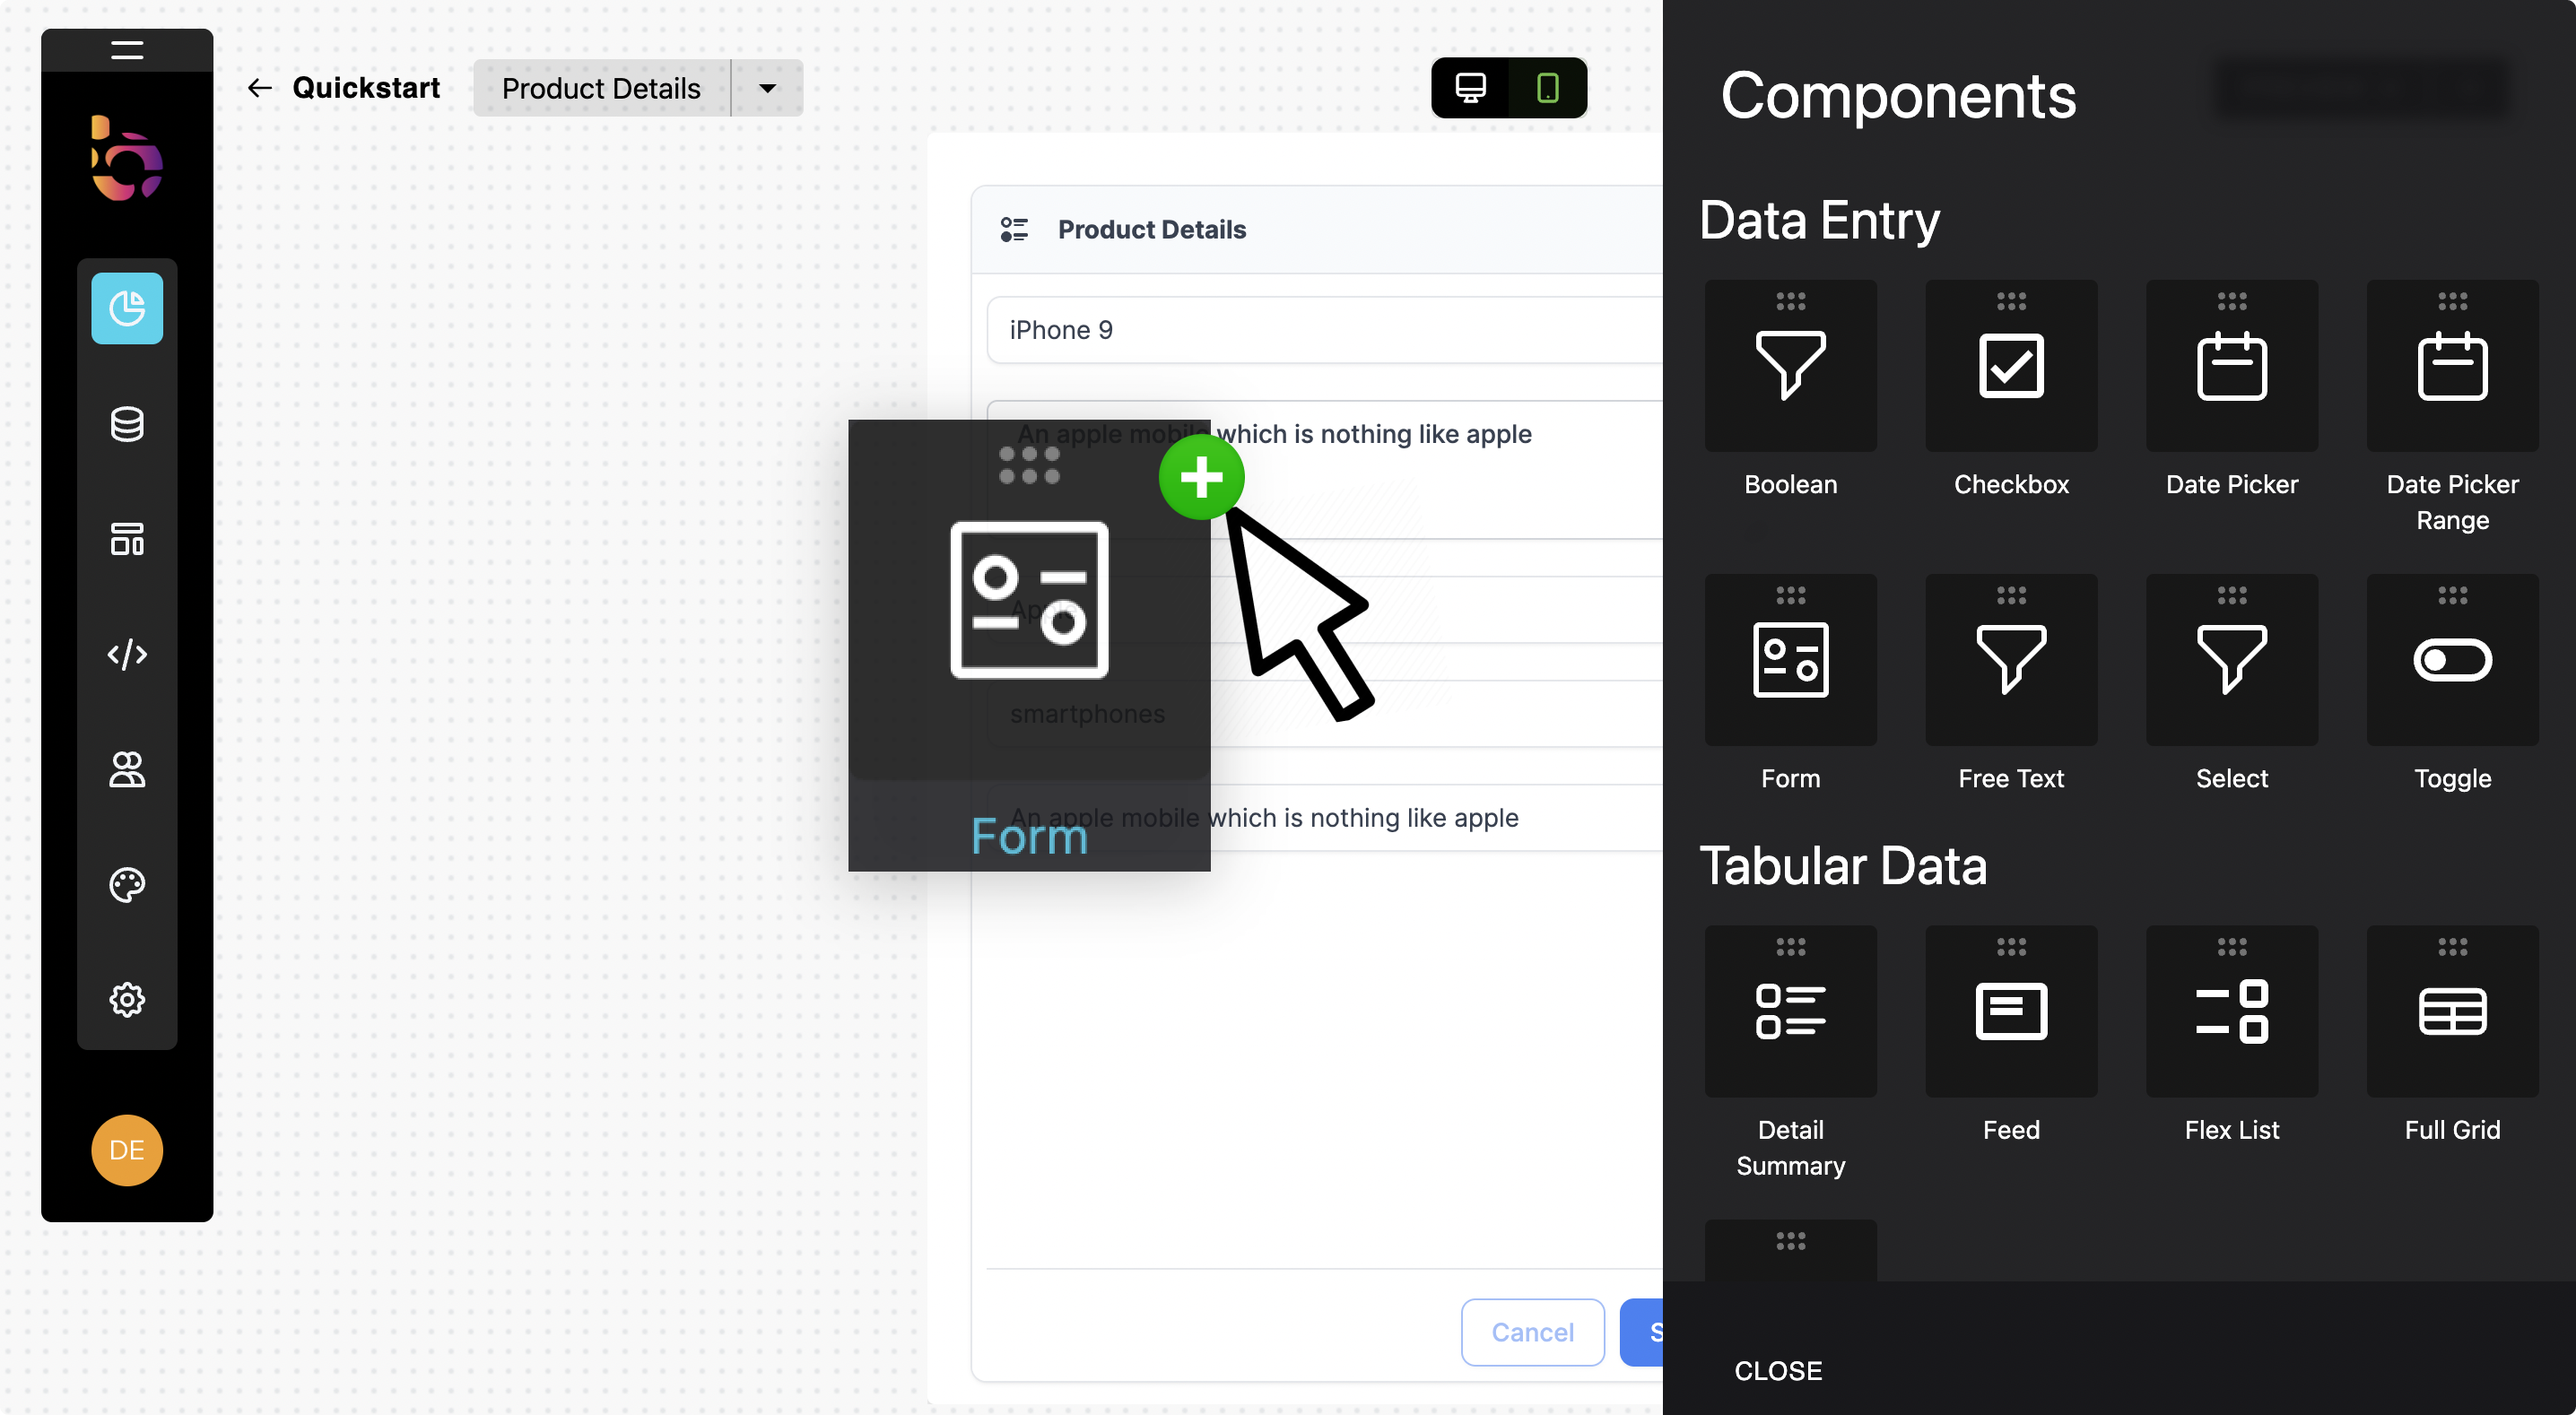
Setting up your form component
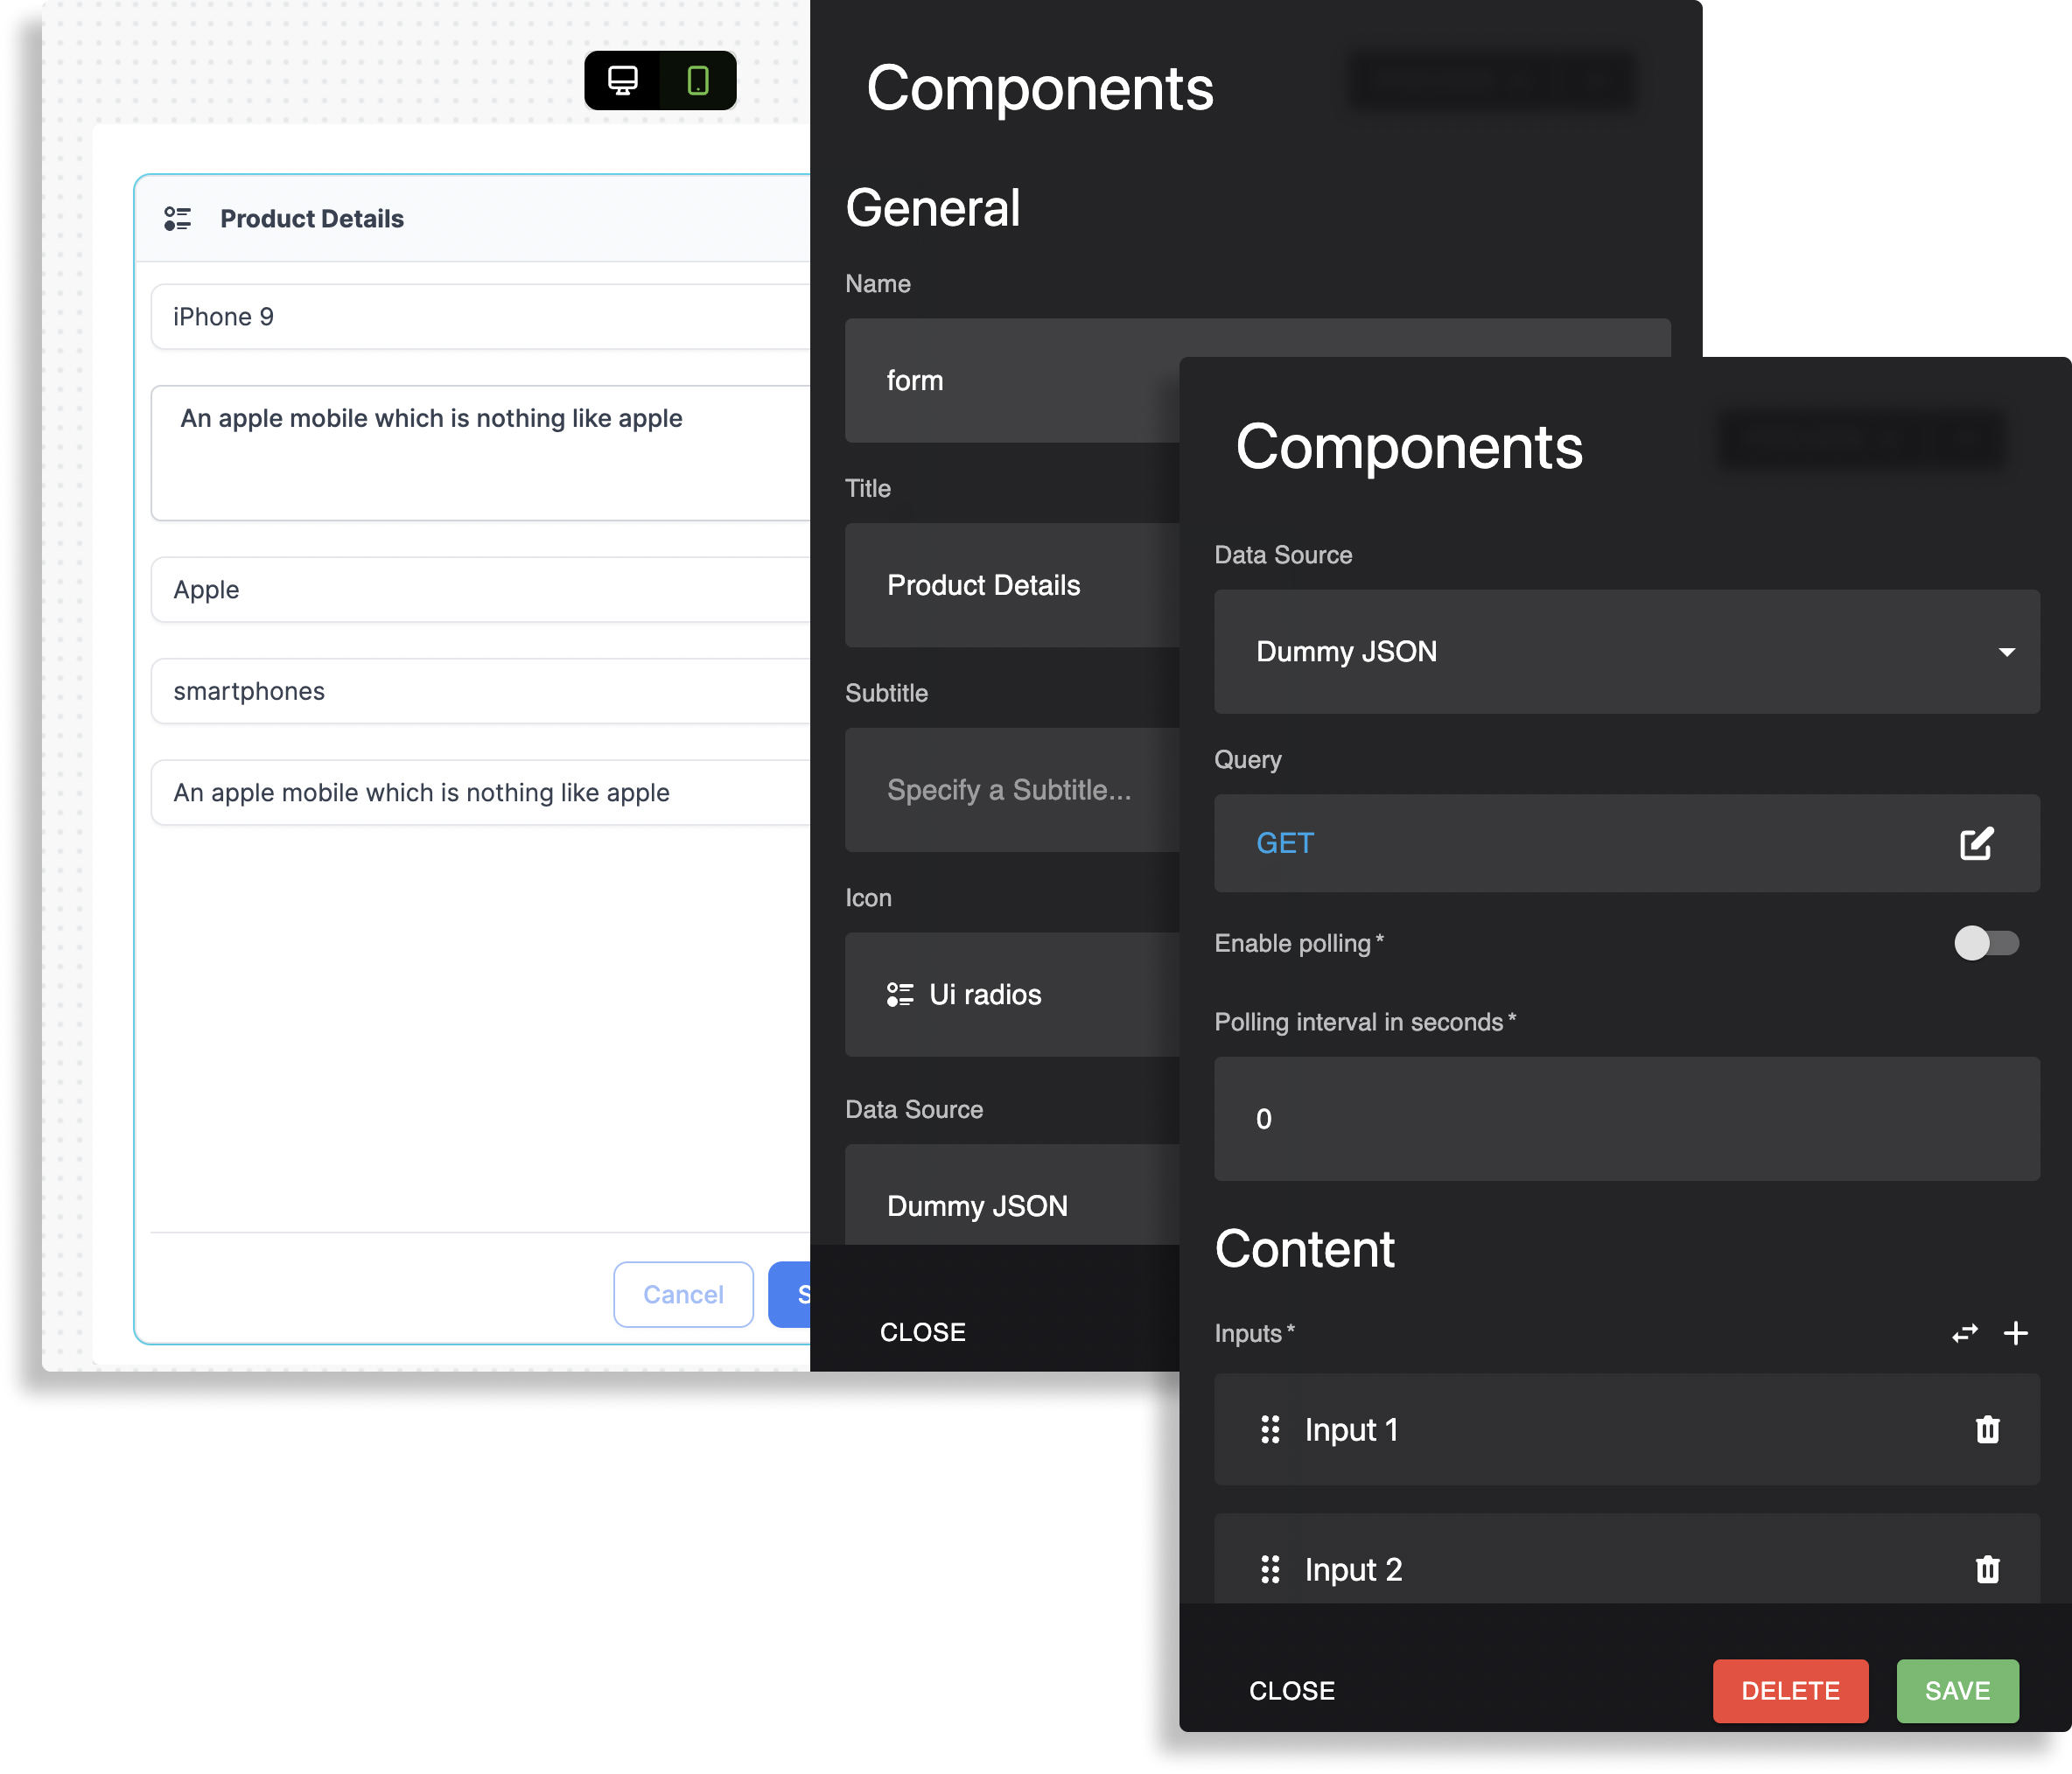
- Choose a
titleandicon. - Choose the
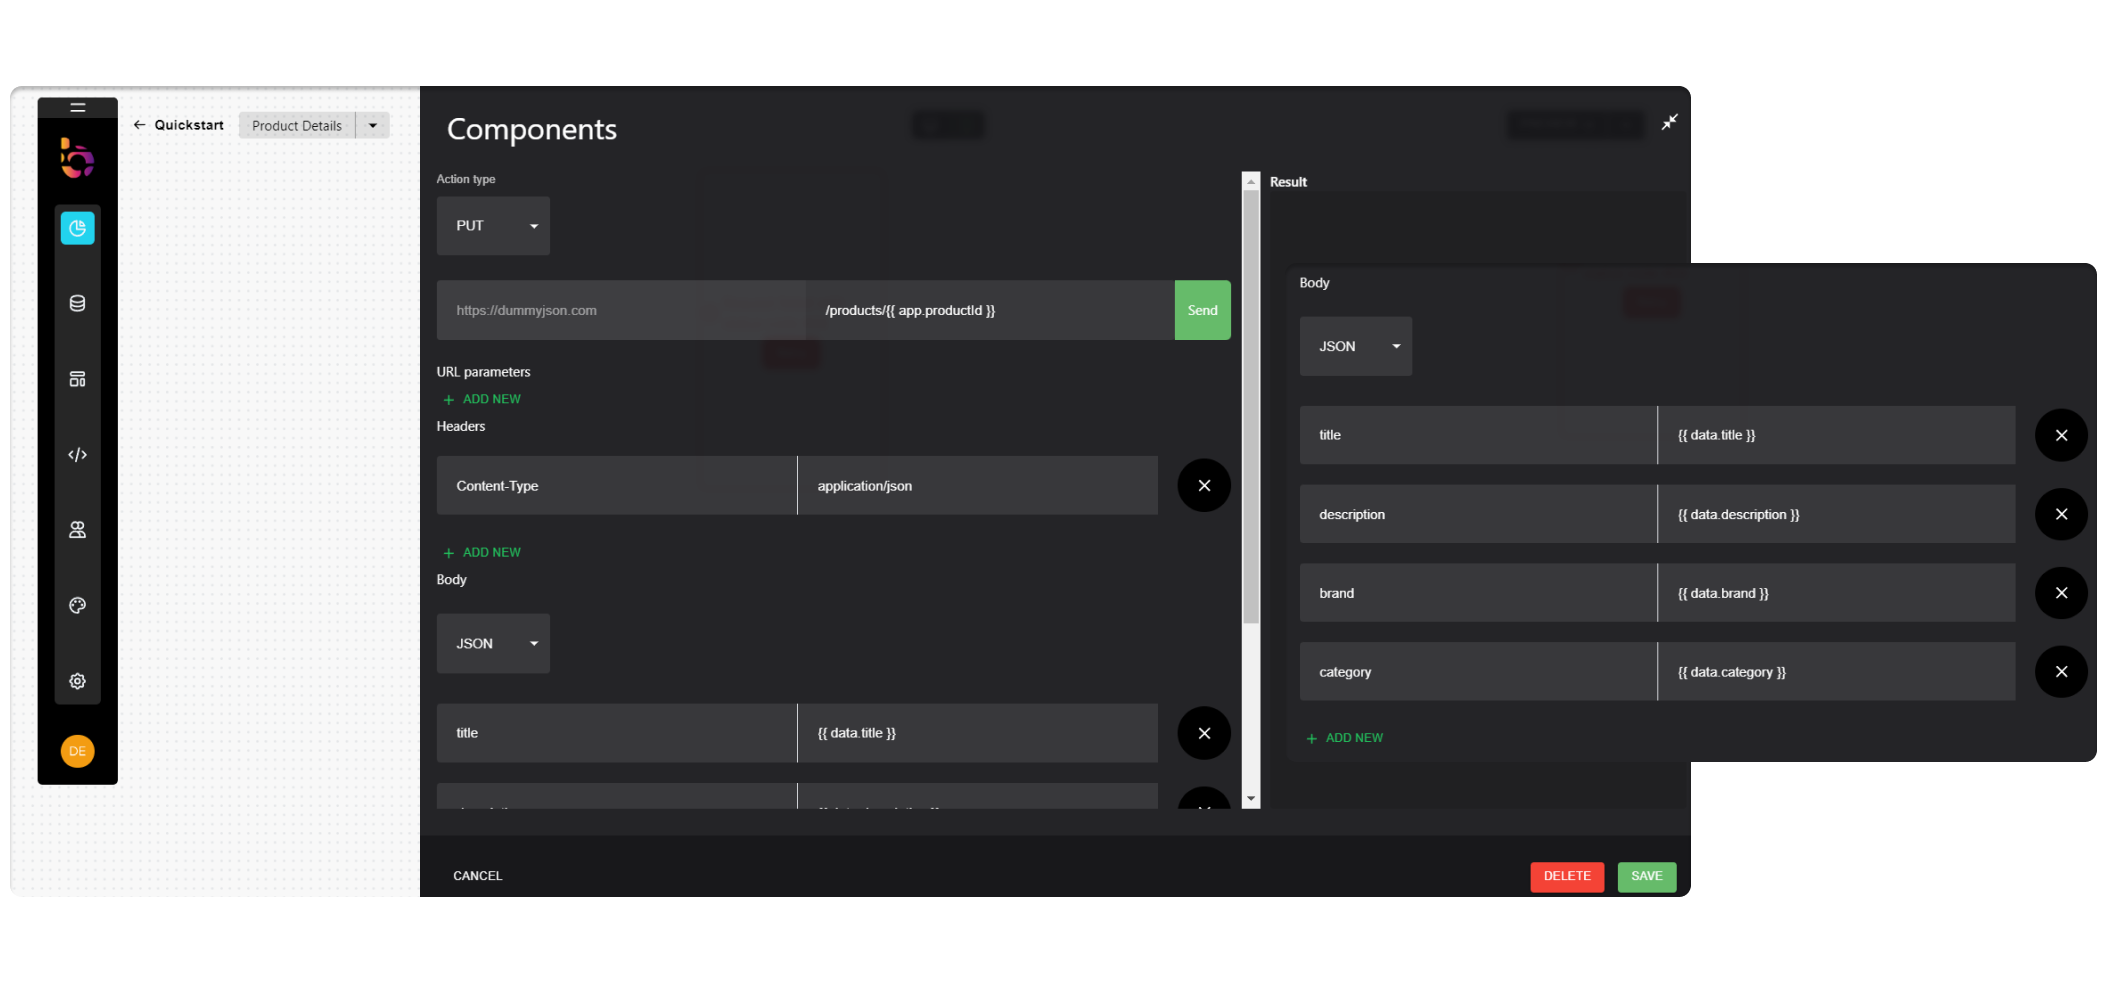
data sourceas Dummy JSON. - Click on
queryto configure the GET request as/products/{{ app.productId }}. - Select values such as
title,description,brand, andcategoryfor each input under content.
Add an action
Now, we will add an action for the product details to trigger the side panel. Let's move to the side panel on the form and configure an action:
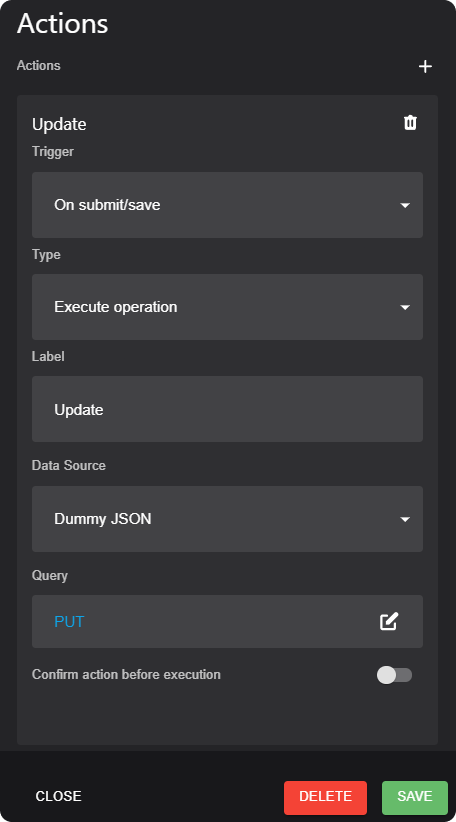
Click on the query to configure the PUT request:
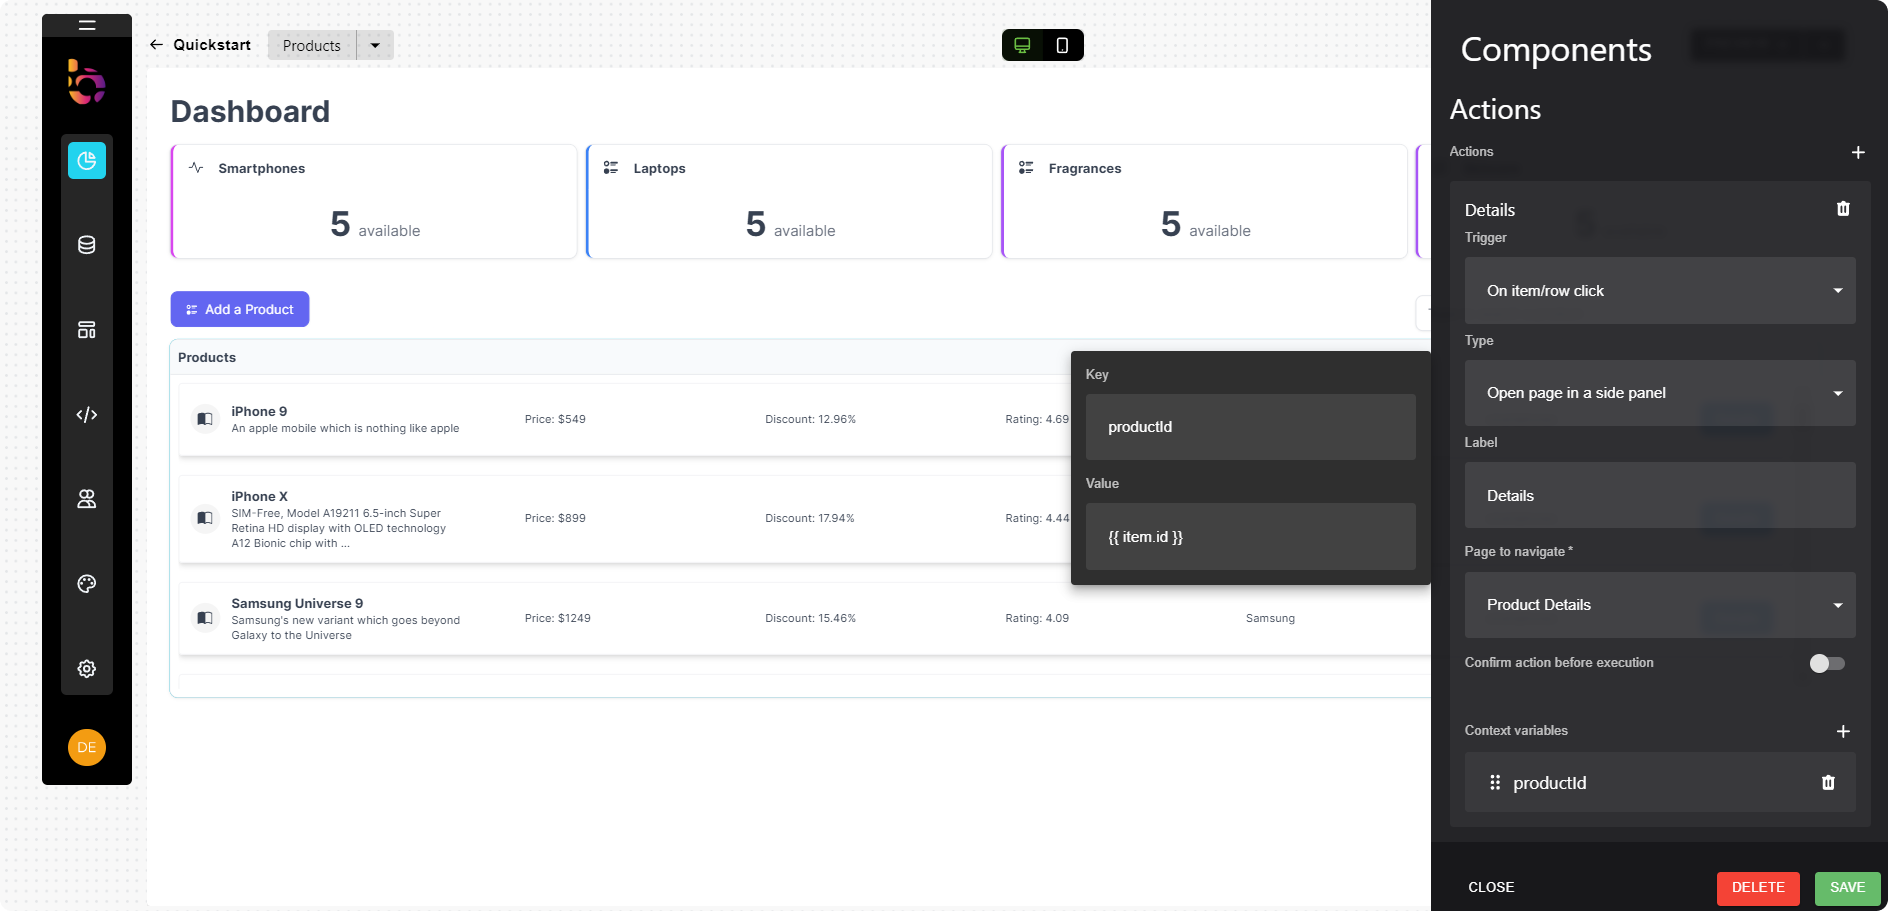
Context Variables
Add a new context variable by clicking on the plus button.
We used {{ app.productId }} in the GET API call of the form, which means that we need to create a context variable productId to be accessed through the app context. For the value let's use the product item's ID, item.id.
Deploy your dashboard
It's the exciting final step – picking a deployment option, and your dashboard will be all set to shine in the spotlight!
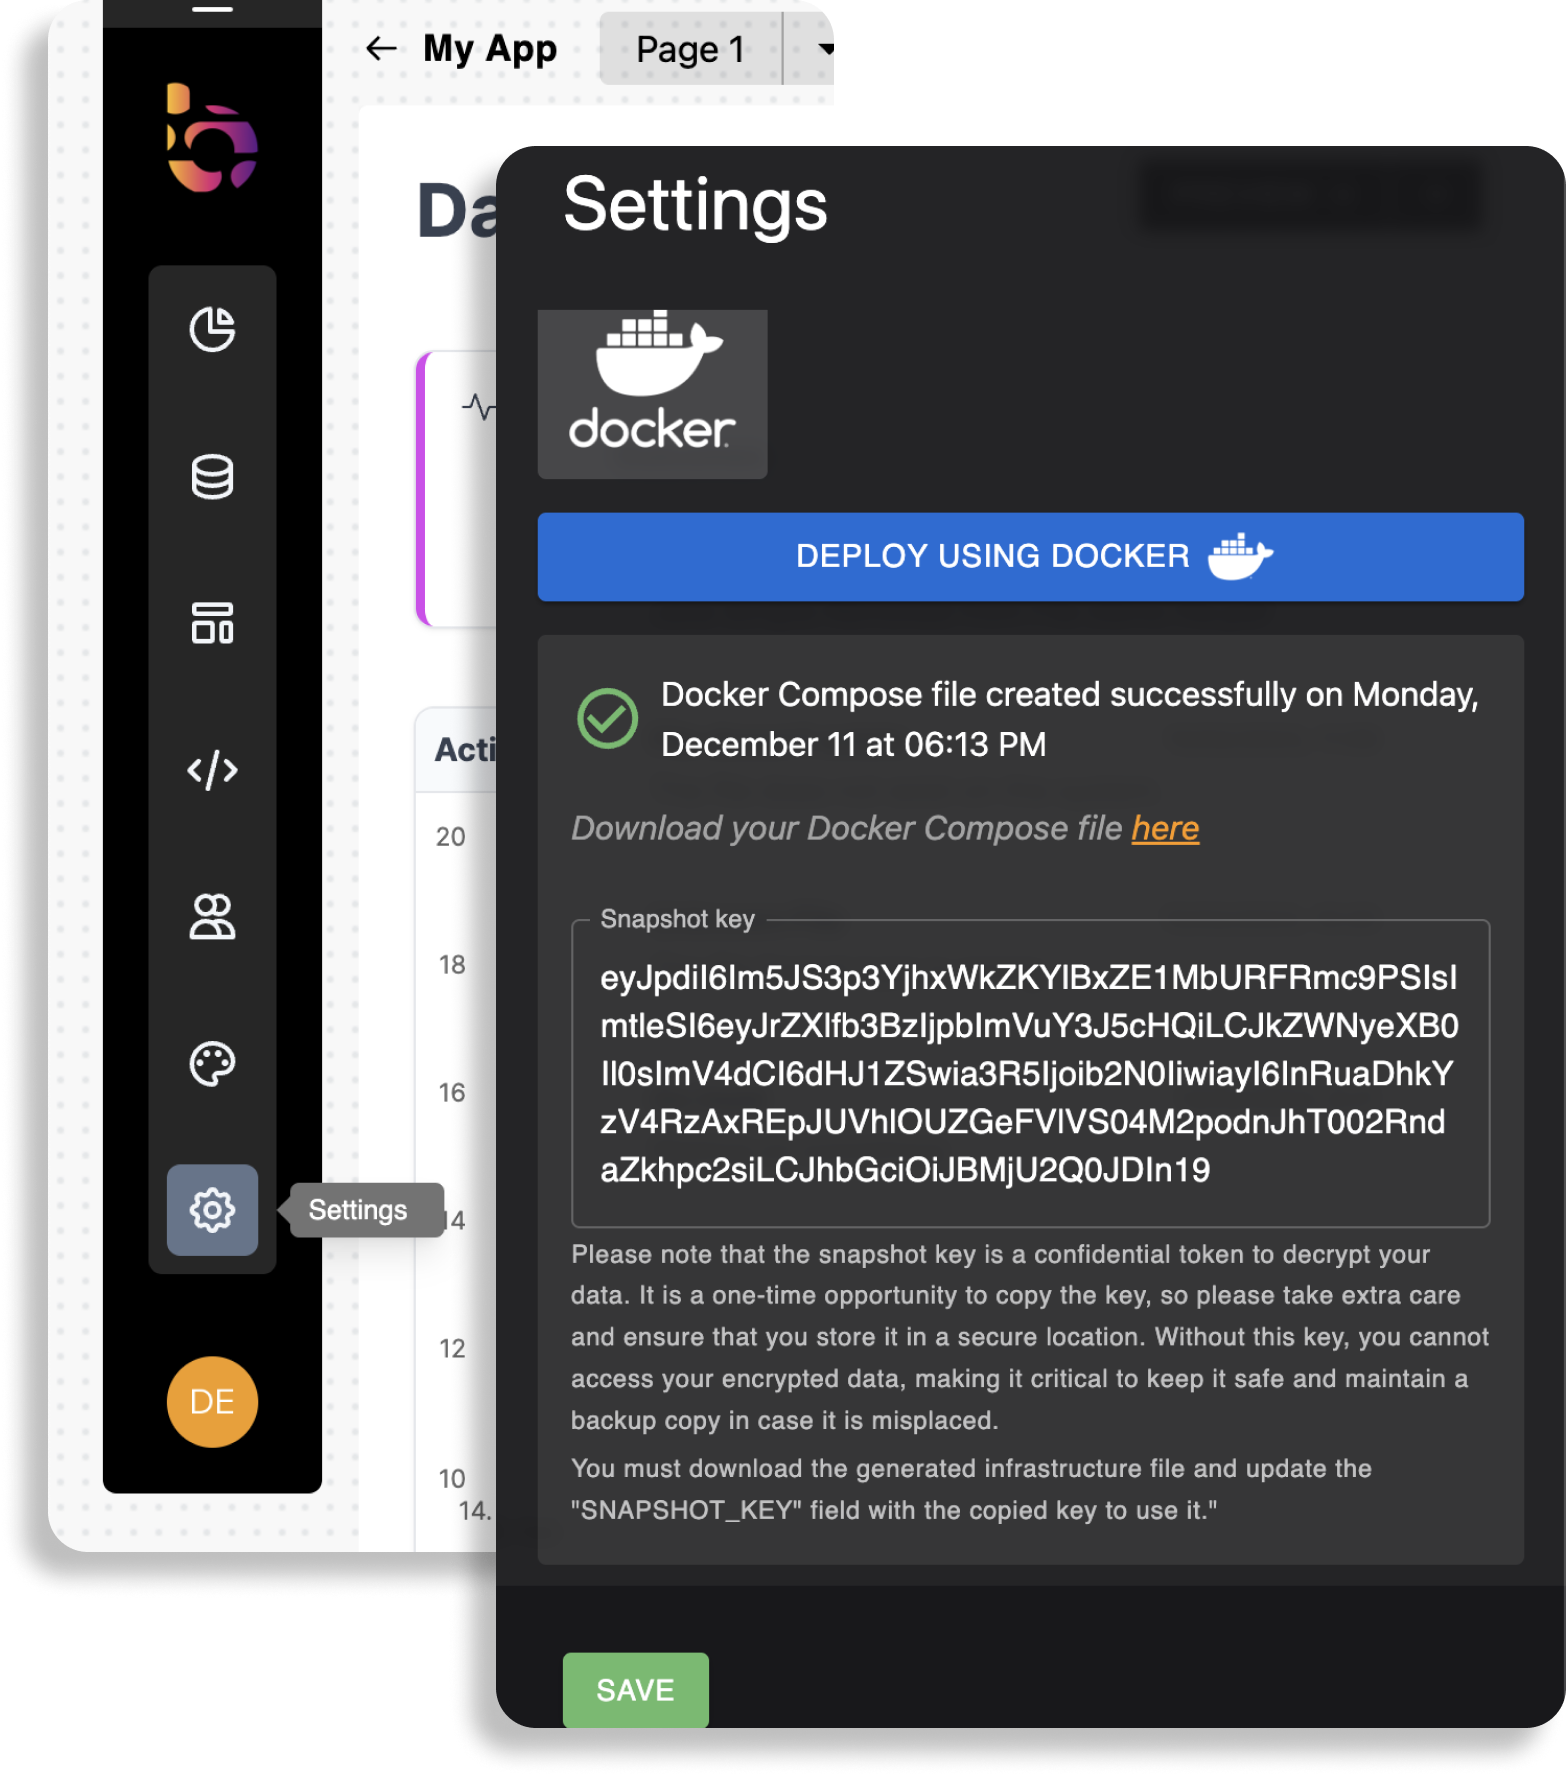

Don't miss our handy tips for a smooth and speedy deployment at deployment config and see our options!
Conclusion
By now, you have successfully created an application that integrates REST API calls and various components for product management. To see how your app looks and functions, click the preview button in the top-right corner.
Bhuma's effectiveness is primarily attributed to its seamless integration of low-code and no-code solutions, enhanced by mapping data sources and JavaScript. The built-in components are highly efficient, significantly reducing the need for extensive front-end coding. However, for more tailored functionality, you have the flexibility to develop custom functions that align with your data requirements and specific objectives.
Feel free to expand the app's capabilities by incorporating additional Key Performance Indicators (KPIs) and implementing features like the Add Product button and its associated form, similar to how you've handled other components.
Updated 3 months ago
Creating a Bhuma platform application is a breeze with just 4 easy steps! The trick to a speedy build is having a clear purpose for your dashboard. Right now, dive into our playbooks to get the lowdown on how our components, general config, and application use cases all come together. Happy exploring! 🛠️📘