
Shadow IT - Risk Score
Drag and drop a Donut KPI
Preview
Instructions
1. Drag and drop the Donut KPI widget onto your dashboard.
2. Change the title and subtitle to "Shadow IT" and "Risk Score" respectively.
3. Choose an icon of your preference to represent the KPI.
Connect the Risk Score KPI to your data source
Preview
Instructions
1. Select "Shadow IT" as the data source from the Data Source menu.
2. Click the query panel to open it.
3. Copy and paste the provided GraphQL query into the query panel.
4. Execute the query to validate the result.
5. Collapse the builder panel using the icon in the upper right corner.
query RiskScoreKPI {
  services_aggregate(where: {is_managed: {_eq: false}}) {
    aggregate {
      avg {
        risk_score
      }
    }
  }
}
Configure the component's content
Preview
Instructions
1. Change the Value to "dynamic", by pressing '<>' and select "Risk Score" from the options.
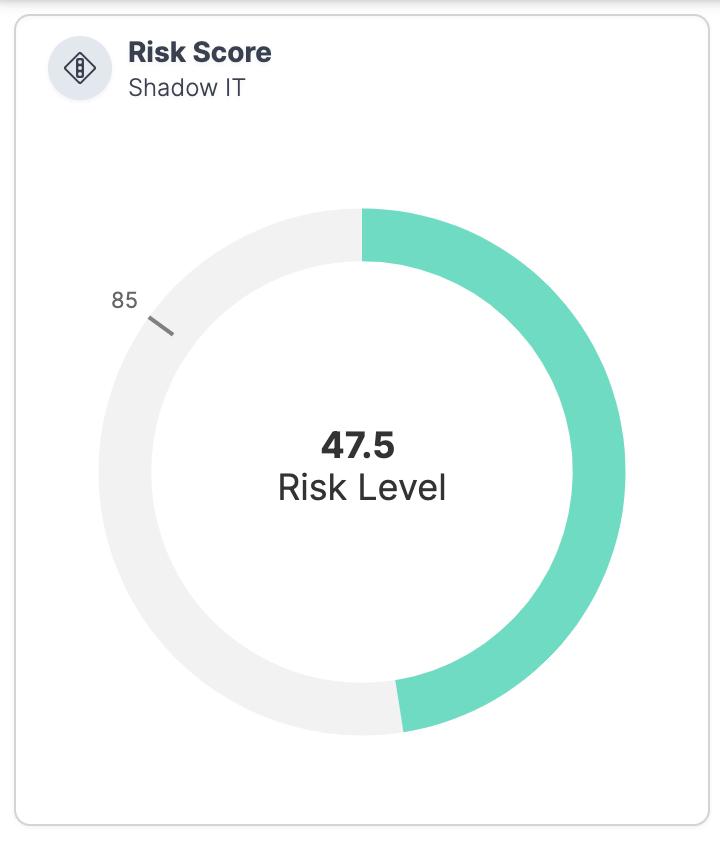
2. Set the target value to 85 to match our business outcome.
3. No suffix or prefix is needed for the display.
3. Use "Risk Level" as the label.
4. Invert the colors to reflect whether being under the target is perceived as good or bad.
Resulting KPI
To achieve the desired outcome, the widget should follow this design.
Updated about 1 year ago