
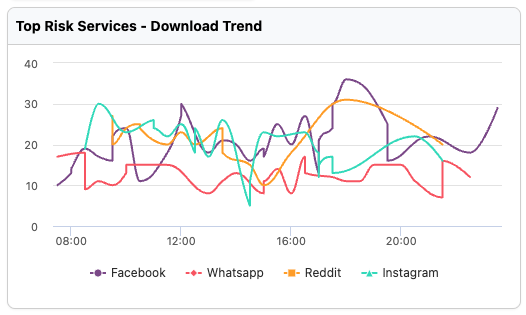
Top Risk Services - Download Trend
Add a Line Chart
Preview
Instructions
1. Drag and drop the line chart onto your dashboard.
2. Change the title to "Top Risk Services - Download Trend".
Connect the line chart to the data source
Preview
Instructions
1. Select "Shadow IT" as the data source from the Data Source menu.
2. Click the query panel to open it.
3. Copy and paste the provided GraphQL query into the query panel.
4. Execute the query to validate the result.
4. Collapse the builder panel using the icon in the upper right corner.
query TopRiskServicesDownloadTrend {
  sessions(where: {service: {is_managed: {_eq: false}}}, order_by: {date: desc}, limit: 100) {
    date
    downloaded
    service {
      name
    }
  }
}
Configure the component's content
Preview
Instructions
1. Add a Path transformation to "sessions".
2. Add a Convert Date transformation to convert the "date" field to milliseconds.
3. In the date transformation put "dateMiliseconds" in "To" field to assign the name to the new converted variable
4. Select "dateMiliseconds" as the X-axis.
5. Choose Group by "name" for the Y-axis.
6. Select "downloaded" as the value.
Resulting Visualization
To achieve the desired outcome, the widget should be designed accordingly.
Updated 8 months ago