
Building your first data app
Part 1
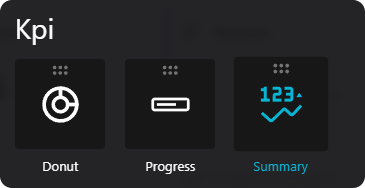
Add a Summary KPI
Select the KPI summary component and drag it into the canvas.
Connect the KPI to a data source
- Click on the component to open the configuration panel
- Choose the
data sourceasWatsonX - Presto - Click on the query to configure the SQL request as follows:
SELECT orderpriority, COUNT(*) AS ordercount
FROM "tpch"."tiny"."orders"
WHERE orderdate >= DATE '1990-01-01'
  AND orderdate < DATE '2024-01-01'
  AND orderpriority = '1-URGENT'
GROUP BY orderpriority
ORDER BY orderpriority
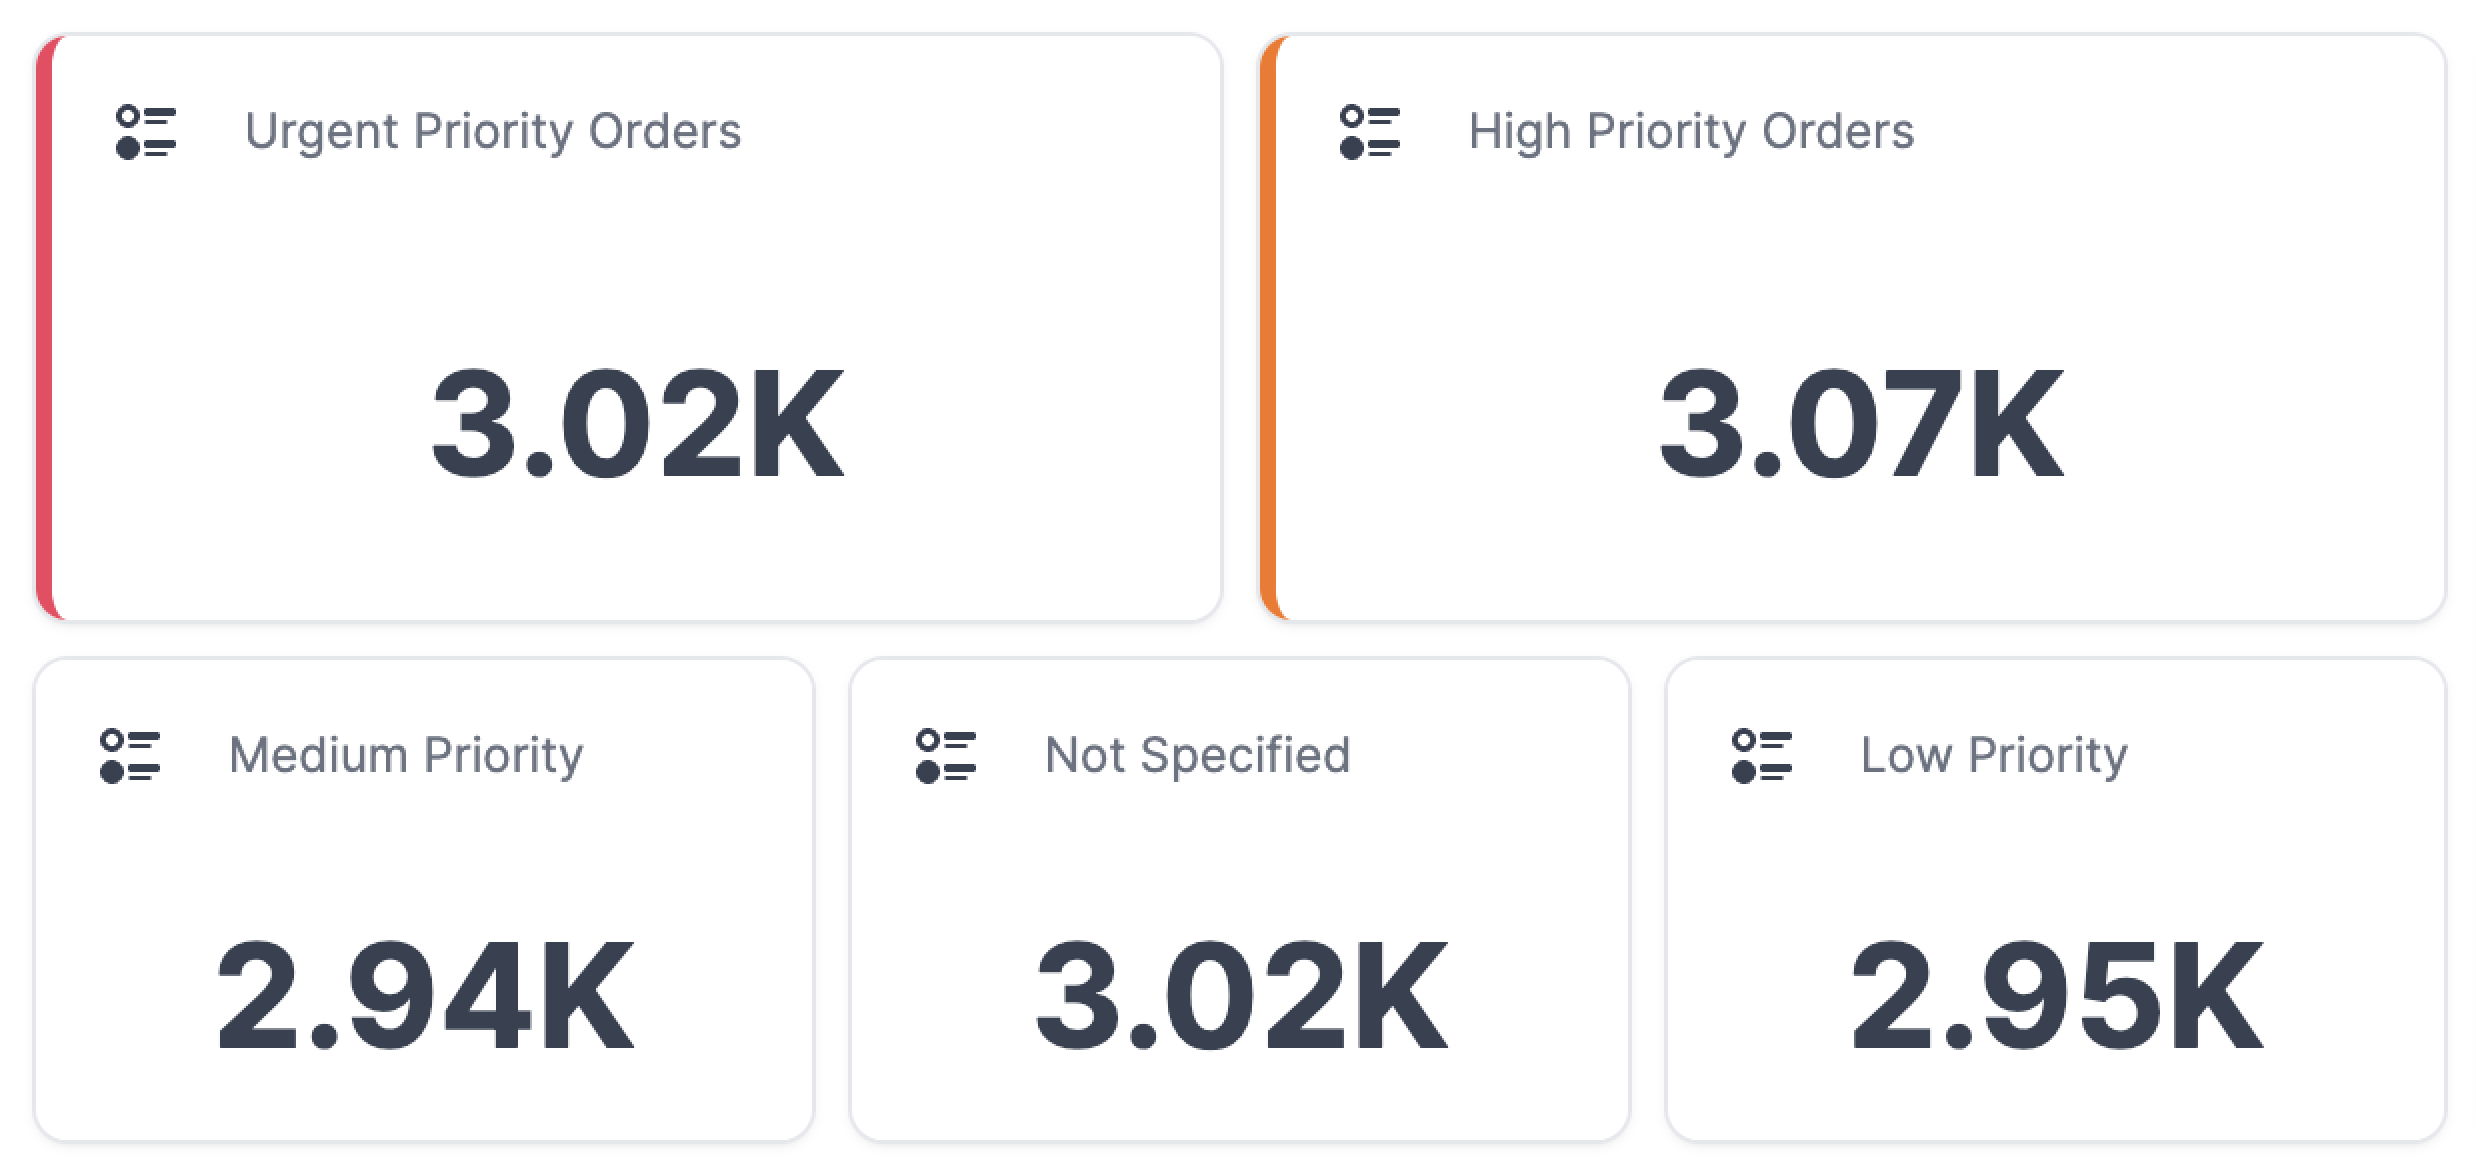
Configure the KPI
- Select the
valueasordercount - On
display valueadd{{formatNumber(self.value, {optionalMantissa: true})}}
This expression is part of the templating system of Bhuma that supports custom formatting functions and transformations, and it's utilized to format a numerical value stored in theself.value, enabling an optional display of the mantissa (decimal part). - Finish the overall configuration by adding a title, icon, and card decorations.
Repeat this process to cover all of the orders by priority.
Part 2
Let's add some visualizations
To determine the volume of business that was done through local suppliers, let's add a column chart using the same data source as before while utilizing the following query:
SELECT n.name AS nation,
    SUM(l.quantity) AS total_local_volume
FROM "tpch"."tiny"."supplier" s
    JOIN "tpch"."tiny"."nation" n ON s.nationkey = n.nationkey
    JOIN "tpch"."tiny"."region" r ON n.regionkey = r.regionkey
    JOIN "tpch"."tiny"."lineitem" l ON s.suppkey = l.suppkey
    JOIN "tpch"."tiny"."orders" o ON l.orderkey = o.orderkey
WHERE orderdate >= DATE '1990-01-01'
    AND orderdate < DATE '2024-01-01'
    AND r.name = 'AMERICA'
GROUP BY n.name
ORDER BY total_local_volume DESC
In this case, we want to group by nation, making sure to use the total_local_volume as a value with a normal stacking.
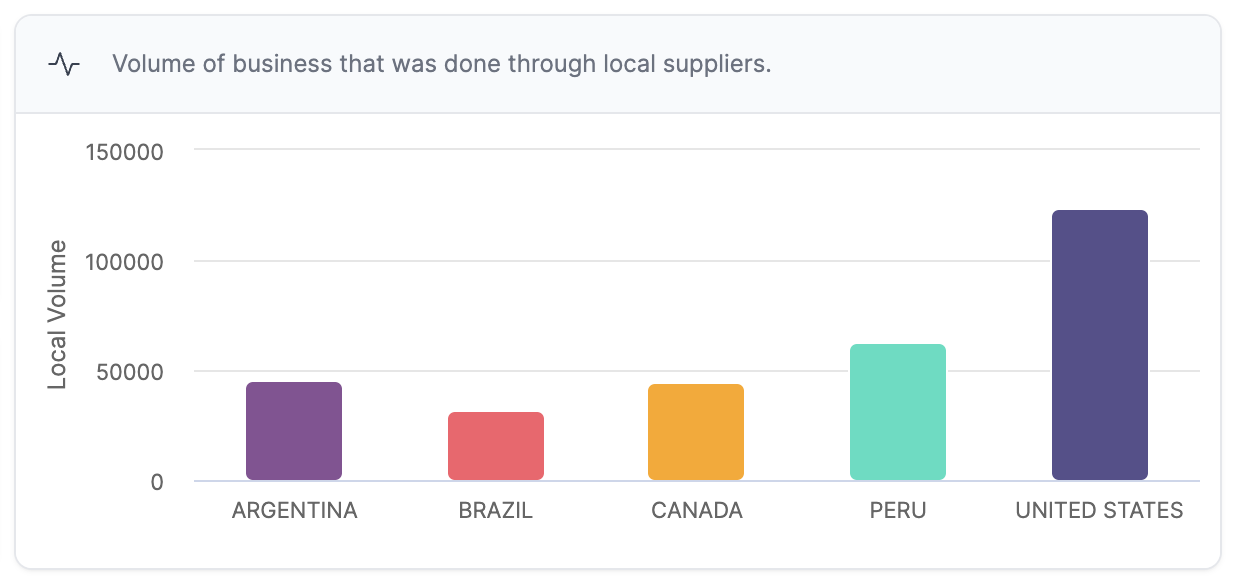
Configure the visualization
Add a title, labels, and icons to enhance the end-user experience. Changes won't persist or be applied until you hit the save button.
Part 3
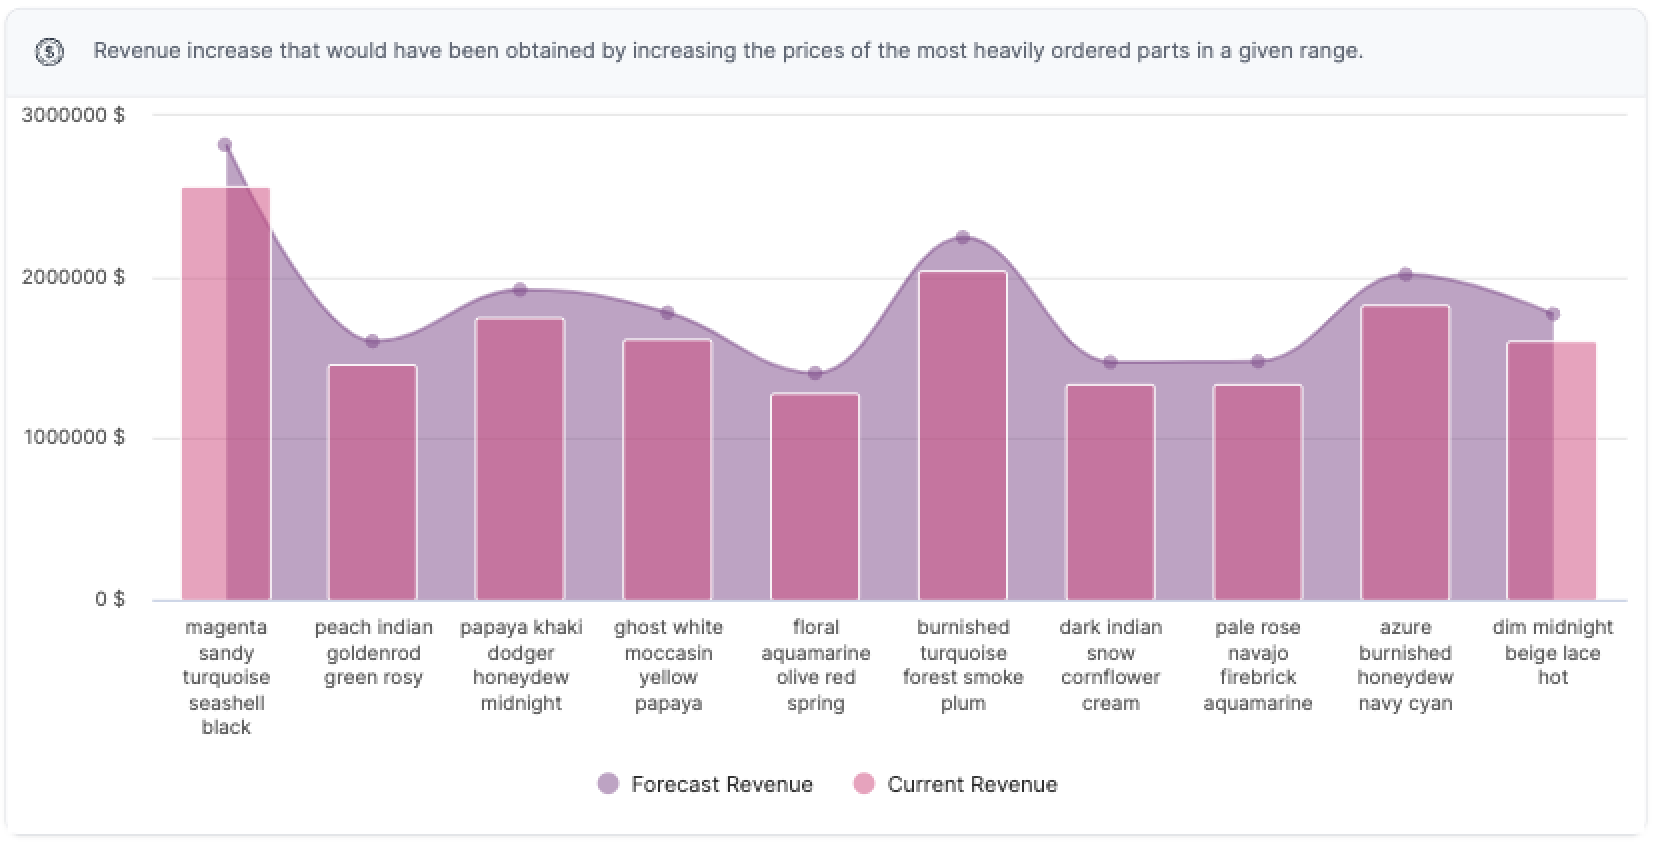
Advanced BI Queries
Creating a visualization that captures the benefits of a forecasting revenue change query, precisely one that predicts the revenue change for a given year if suppliers in another nation instead shipped the parts currently shipped by suppliers in a specific nation, can provide several key advantages, especially on cost optimization. and market responsiveness.
A given example of this would be:
WITH OrderedPartsSummary AS (
    SELECT l.partkey,
        SUM(l.quantity) AS total_quantity_ordered
    FROM "tpch"."tiny"."lineitem" l
        JOIN "tpch"."tiny"."orders" o ON l.orderkey = o.orderkey
    WHERE orderdate >= DATE '1990-01-01'
        AND orderdate < DATE '2024-01-01'
    GROUP BY l.partkey
    ORDER BY total_quantity_ordered DESC
    LIMIT 10 -- N most heavily ordered parts
), RevenueIncreaseEstimation AS (
    SELECT ops.partkey,
        SUM(l.extendedprice) AS current_revenue,
        SUM(l.extendedprice * 1.1) - SUM(l.extendedprice) AS potential_revenue_increase
    FROM "tpch"."tiny"."lineitem" l
        JOIN OrderedPartsSummary ops ON l.partkey = ops.partkey
        JOIN "tpch"."tiny"."orders" o ON l.orderkey = o.orderkey
    WHERE orderdate >= DATE '1990-01-01'
        AND orderdate < DATE '2024-01-01'
    GROUP BY ops.partkey
)
SELECT p.name,
    rei.current_revenue,
    (
        rei.potential_revenue_increase + rei.current_revenue
    ) as forecasted
FROM RevenueIncreaseEstimation rei
    JOIN "tpch"."tiny"."part" p ON rei.partkey = p.partkey
Updated 11 months ago