
Sessions Length
Add a Bar Chart
Preview
Instructions
1. Drag and drop the bar chart onto your dashboard.
2. Remove the subtitle from the chart.
3. Change the title to "Sessions Length".
Connect the Sessions Length to the data source
Preview
Instructions
1. Select "Shadow IT" as the data source from the Data Source menu.
2. Click the query panel to open it.
3. Copy and paste the provided GraphQL query into the query panel.
4. Execute the query to validate the result.
5. Collapse the builder panel using the icon in the upper right corner.
query ShadowITSessions {
  services(where: {is_managed: {_eq: false}}, order_by: {sessions_aggregate: {sum: {session_length:desc}}}) {
    name
    sessions_aggregate {
      aggregate {
        sum {
          session_length
        }
      }
    }
  }
}
Configure the component's content
Preview
Instructions
1. Select "name" as the Category field.
2. Scroll to Series and update the Series Name to "Sessions Length".
3. Select "session_length" as the X-axis field.
4. Remove the suffix from the X-axis.
5. Remove the legend from the chart.
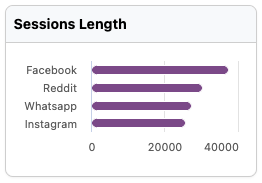
Resulting Visualization
To achieve the desired outcome, the widget should be designed accordingly.
Updated about 1 year ago